Chemical Sciences Journal, Vol. 2012: CSJ-7632.1.1 Glycolysis of PET soft drink bottlesPET waste were glycolyzed using PPG (molecular weight 2000) in a three-necked glass reaction kettle equippedwith stirrer, condenser. Zinc acetate (0.5%) was used as a catalyst. The content of the reaction kettle washeated at 180 ◦ C for 1 h; subsequently the temperature was raised to 210 ◦ C until all the solids disappeared. Thereaction mixture was cooled and the products obtained were trans-esterified with Castor/Jatropha oil. Table 1shows the various compositions of PET and PPG taken for glycolysis.Table 1: Weight of PPG taken with PEG of various weights.Molecular Weight of PPG Weight of PET Zinc Acetate (g)2000 5% 0.5%2000 10% 0.5%2.1.2 Trans-esterificationTrans-esterification of glycolyzed oligoesters was carried out using Castor/Jatropha oil with a weight ratio of1:10. DBTDL (Dibutyltin Dilaurate) (2 wt %) was used as a catalyst. In a typical process of trans-esterification,required amounts of glycolyzed oligoesters, Castor/Jatropha oil and catalyst were charged in a three-neckedreaction kettle equipped with stirrer, vacuum line.The reaction mixture was heated at 80 ◦ C without vacuum for half an hour; the temperature was thenraised to 150 ◦ C with a vacuum of 125mmHg. The conditions were maintained for 1.5 h. The by-product formedwas continuously removed by vacuum. After the completion of the reaction, the mass was cooled to roomtemperature and brought to atmospheric pressure slowly. The polyester polyols thus obtained werecharacterized using Fourier transform infrared (FTIR) spectroscopy.2.2 Formulation of coating systemsTwo-pack coating systems were formulated using the polyester polyols as base component and melamineformaldehyde as curing agent. The components were mixed in the weight ratio of 1:1. The thoroughly mixedcompositions were coated on mild steel panels, using a bar applicator. The panels were placed in an oven at120 ◦ C for 30 min. These panels were used to evaluate various performances.2.3 FTIR spectroscopyGlycolysis of PET waste and the formation of polyester polyols were confirmed using FTIR spectroscopy. FTIRspectra were recorded as a film on a KBr cell using a Perkin Elmer Spectrum BX instrument.2.4 Panel preparationMild steel panels (2”x 3”) were prepared, prior to application of coating, as follows. First, panels were handscrubbed using a maroon scotch-briteR with 10% solution of Brulin 815 GDR detergent in DI water and thenrinsed with DI water. They were then immersed in 10% solution of Brulin 815 GDR detergent in DI water atminimum 142 F, followed by washing with DI water. Then the panels were deoxidized for 2 min in phosphoricacid-based deoxidizing solution, followed by DI water rinse and drying, and were then stacked for 24 h beforebeing used for application. Before coating application all the panels were washed with DI water for removal ofany loose dirt on the surface.2.5 Performance properties evaluationSaturated polyester polyol-based coatings were applied on mild steel panels for various tests. These includeMEK double rub test, pencil hardness test, chemical and solvent resistance test and corrosion resistanceperformance test (EIS).2.5.1 MEK double-rub testThe MEK solvent-rub test is a well-known and frequently used test throughout the coating industry. Its primaryutility to determine the extent, to which a coating is cured when interpreted properly, can be a very usefultool. The test itself is simple a cotton ball or rag is soaked in MEK and rubbed over the surface of coating agiven number of times. The effect on the surface is then evaluated in terms of gloss loss, softening, or degreeof rub off. The result of this type of test provides a measure of the chemical resistance of a given coating.When the results are compared to those of a control, known to be fully cured, a good qualitativedetermination of the degree of can be made.http://astonjournals.com/csj
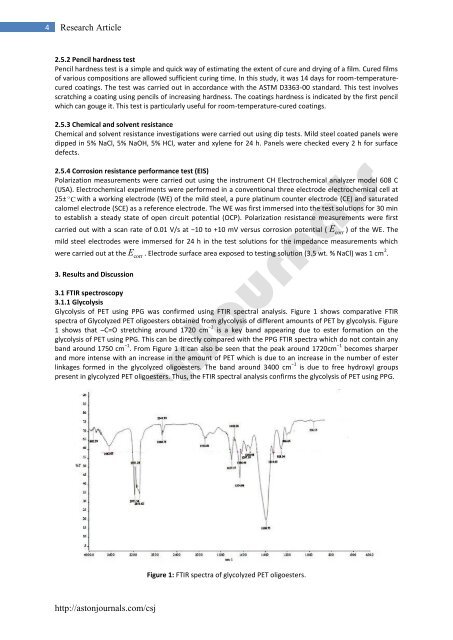
4 Research Article2.5.2 Pencil hardness testPencil hardness test is a simple and quick way of estimating the extent of cure and drying of a film. Cured filmsof various compositions are allowed sufficient curing time. In this study, it was 14 days for room-temperaturecuredcoatings. The test was carried out in accordance with the ASTM D3363-00 standard. This test involvesscratching a coating using pencils of increasing hardness. The coatings hardness is indicated by the first pencilwhich can gouge it. This test is particularly useful for room-temperature-cured coatings.2.5.3 Chemical and solvent resistanceChemical and solvent resistance investigations were carried out using dip tests. Mild steel coated panels weredipped in 5% NaCl, 5% NaOH, 5% HCl, water and xylene for 24 h. Panels were checked every 2 h for surfacedefects.2.5.4 Corrosion resistance performance test (EIS)Polarization measurements were carried out using the instrument CH Electrochemical analyzer model 608 C(USA). Electrochemical experiments were performed in a conventional three electrode electrochemical cell at25± C with a working electrode (WE) of the mild steel, a pure platinum counter electrode (CE) and saturatedcalomel electrode (SCE) as a reference electrode. The WE was first immersed into the test solutions for 30 minto establish a steady state of open circuit potential (OCP). Polarization resistance measurements were firstcarried out with a scan rate of 0.01 V/s at −10 to +10 mV versus corrosion potential (Ecorr) of the WE. Themild steel electrodes were immersed for 24 h in the test solutions for the impedance measurements whichwere carried out at the E . Electrode surface area exposed to testing solution (3.5 wt. % NaCl) was 1 cm 2 .3. Results and Discussioncorr3.1 FTIR spectroscopy3.1.1 GlycolysisGlycolysis of PET using PPG was confirmed using FTIR spectral analysis. Figure 1 shows comparative FTIRspectra of Glycolyzed PET oligoesters obtained from glycolysis of different amounts of PET by glycolysis. Figure1 shows that –C=O stretching around 1720 cm −1 is a key band appearing due to ester formation on theglycolysis of PET using PPG. This can be directly compared with the PPG FTIR spectra which do not contain anyband around 1750 cm −1 . <strong>From</strong> Figure 1 it can also be seen that the peak around 1720cm −1 becomes sharperand more intense with an increase in the amount of PET which is due to an increase in the number of esterlinkages formed in the glycolyzed oligoesters. The band around 3400 cm −1 is due to free hydroxyl groupspresent in glycolyzed PET oligoesters. Thus, the FTIR spectral analysis confirms the glycolysis of PET using PPG.Figure 1: FTIR spectra of glycolyzed PET oligoesters.http://astonjournals.com/csj



![[1,4]-benzodiazepine-2-one Derivatives as Potent - AstonJournals](https://img.yumpu.com/49117784/1/184x260/14-benzodiazepine-2-one-derivatives-as-potent-astonjournals.jpg?quality=85)
