Determining Molar Mass by Freezing Point Depression
Determining Molar Mass by Freezing Point Depression
Determining Molar Mass by Freezing Point Depression

Create successful ePaper yourself
Turn your PDF publications into a flip-book with our unique Google optimized e-Paper software.
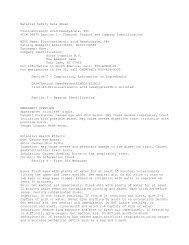
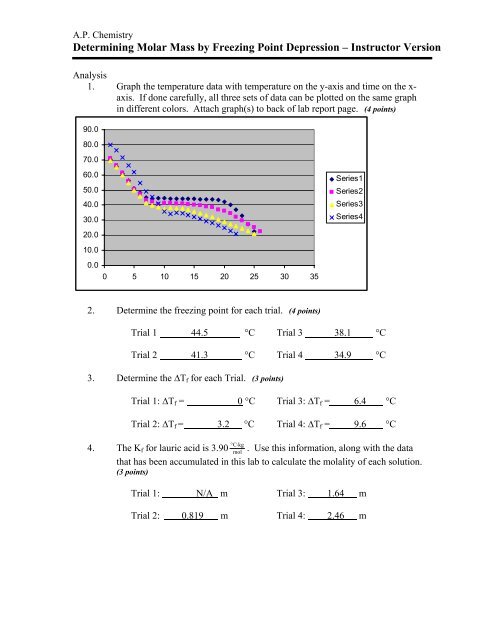
A.P. Chemistry<strong>Determining</strong> <strong>Molar</strong> <strong>Mass</strong> <strong>by</strong> <strong>Freezing</strong> <strong>Point</strong> <strong>Depression</strong> – Instructor VersionAnalysis1. Graph the temperature data with temperature on the y-axis and time on the x-axis. If done carefully, all three sets of data can be plotted on the same graphin different colors. Attach graph(s) to back of lab report page. (4 points)90.080.070.060.050.040.030.020.010.00.00 5 10 15 20 25 30 35Series1Series2Series3Series42. Determine the freezing point for each trial. (4 points)Trial 1 44.5 °C Trial 3 38.1 °CTrial 2 41.3 °C Trial 4 34.9 °C3. Determine the ∆T f for each Trial. (3 points)Trial 1: ∆T f = 0 °C Trial 3: ∆T f = 6.4 °CTrial 2: ∆T f = 3.2 °C Trial 4: ∆T f = 9.6 °C°C⋅kg4. The K f for lauric acid is 3.90 mol. Use this information, along with the datathat has been accumulated in this lab to calculate the molality of each solution.(3 points)Trial 1: N/A m Trial 3: 1.64 mTrial 2: 0.819 m Trial 4: 2.46 m