A Brief Introduction to Evidence-Centered Design CSE Report 632 ...
A Brief Introduction to Evidence-Centered Design CSE Report 632 ...
A Brief Introduction to Evidence-Centered Design CSE Report 632 ...

Create successful ePaper yourself
Turn your PDF publications into a flip-book with our unique Google optimized e-Paper software.
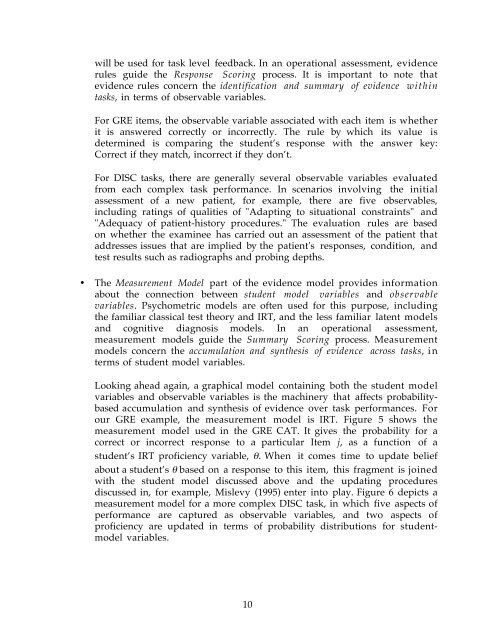
will be used for task level feedback. In an operational assessment, evidencerules guide the Response Scoring process. It is important <strong>to</strong> note thatevidence rules concern the identification and summary of evidence withintasks, in terms of observable variables.For GRE items, the observable variable associated with each item is whetherit is answered correctly or incorrectly. The rule by which its value isdetermined is comparing the student’s response with the answer key:Correct if they match, incorrect if they don’t.For DISC tasks, there are generally several observable variables evaluatedfrom each complex task performance. In scenarios involving the initialassessment of a new patient, for example, there are five observables,including ratings of qualities of "Adapting <strong>to</strong> situational constraints" and"Adequacy of patient-his<strong>to</strong>ry procedures." The evaluation rules are basedon whether the examinee has carried out an assessment of the patient thataddresses issues that are implied by the patient's responses, condition, andtest results such as radiographs and probing depths.• The Measurement Model part of the evidence model provides informationabout the connection between student model variables and observablevariables. Psychometric models are often used for this purpose, includingthe familiar classical test theory and IRT, and the less familiar latent modelsand cognitive diagnosis models. In an operational assessment,measurement models guide the Summary Scoring process. Measurementmodels concern the accumulation and synthesis of evidence across tasks, interms of student model variables.Looking ahead again, a graphical model containing both the student modelvariables and observable variables is the machinery that affects probabilitybasedaccumulation and synthesis of evidence over task performances. Forour GRE example, the measurement model is IRT. Figure 5 shows themeasurement model used in the GRE CAT. It gives the probability for acorrect or incorrect response <strong>to</strong> a particular Item j, as a function of astudent’s IRT proficiency variable, θ. When it comes time <strong>to</strong> update beliefabout a student’s θ based on a response <strong>to</strong> this item, this fragment is joinedwith the student model discussed above and the updating proceduresdiscussed in, for example, Mislevy (1995) enter in<strong>to</strong> play. Figure 6 depicts ameasurement model for a more complex DISC task, in which five aspects ofperformance are captured as observable variables, and two aspects ofproficiency are updated in terms of probability distributions for studentmodelvariables.10