- Page 1 and 2:
GAMBLING IMPACT STUDY:Part 1, Secti
- Page 3 and 4:
Harness Racing ....................
- Page 5 and 6:
7. Conclusion .....................
- Page 7 and 8:
Figure 66: Florida jai alai handle
- Page 9 and 10:
Executive SummaryIntroductionThe Fl
- Page 11 and 12:
Operators with cardrooms are requir
- Page 13 and 14:
Fiscal ImpactsOur analysis examines
- Page 15 and 16:
future of their state. Our experien
- Page 17 and 18:
end, REMI relied on its Tax-PI mode
- Page 19 and 20:
Political: Among various private in
- Page 21 and 22:
That does not mean that the industr
- Page 23 and 24:
That latter point can be illustrate
- Page 25 and 26:
casino referenda, however, gambling
- Page 27 and 28:
Statutes. For horse racing, the fee
- Page 29 and 30:
While Hooke is correct in that stat
- Page 31 and 32:
The need to respond to actions in o
- Page 33 and 34:
(at 9.4 percent and 9.9 percent, re
- Page 35 and 36:
3. Battle for Entertainment Dollars
- Page 37 and 38:
eight food courts and remote airlin
- Page 39 and 40:
Florida is a “right to work” st
- Page 41 and 42:
Bunkley said. “We have a lot of p
- Page 43 and 44:
5 states have standalone cardrooms,
- Page 45 and 46:
Of course, gambling incidence varie
- Page 47 and 48:
90.0%72.7%63.0%32.0%30.5%27.7%19.6%
- Page 49 and 50:
44%57%25%23%21%12%6%8%7%8%12%10%6%7
- Page 51 and 52:
sport survives, in large measure be
- Page 53 and 54:
Yet, with 1,450 slots and 48 poker
- Page 55 and 56:
said it would consider capital inve
- Page 57 and 58:
Figure 12: EBITDA return on investe
- Page 59 and 60:
profitability. A hotel that was cos
- Page 61 and 62:
eport refer solely to permanent res
- Page 63 and 64:
While casinos grew in the state it
- Page 65 and 66:
Note the second column in the above
- Page 67 and 68:
limits in 2008. Colorado raised the
- Page 69 and 70:
Figure 17: Analysis of select casin
- Page 71 and 72:
Figure 19: Changing tax rates over
- Page 73 and 74:
the US and on four continents aroun
- Page 75 and 76:
closer to a destination. The expans
- Page 77 and 78:
Number of Native Ameican CasinosGro
- Page 79 and 80:
showed that Poarch Band gaming at P
- Page 81 and 82:
Certainly, the creation of new wage
- Page 83 and 84:
In FY 2012, Florida’s pari-mutuel
- Page 85 and 86:
It is critical for policymakers to
- Page 87 and 88:
Yonkers Raceway in New York, and th
- Page 89 and 90:
e. Impact of Slot Machine Casinos,
- Page 91 and 92:
FY 2012, a decline of 33 percent wh
- Page 93 and 94:
wagered on the Gulfstream Park sign
- Page 95 and 96:
noted that racing will be integrate
- Page 97 and 98:
90 percent rule. Pari-mutuel operat
- Page 99 and 100:
compounds in rows of small stacked
- Page 101 and 102:
One area that Spectrum’s research
- Page 103 and 104:
Poker in Florida began to increase
- Page 105 and 106:
playing of bingo. The statute stric
- Page 107 and 108:
In Florida, the downward trend in n
- Page 109 and 110:
greater Miami-Dade area. The bingo
- Page 111 and 112:
egressivity of the lottery. While c
- Page 113 and 114:
Sales in millions199019911992199319
- Page 115 and 116:
MillionsRetail gaming is a crucial
- Page 117 and 118:
Sports betting revenue in $ million
- Page 119 and 120:
Montana does not offer traditional
- Page 121 and 122:
unregulated bingo wagering can comp
- Page 123 and 124:
legislation. 257 So have trade asso
- Page 125 and 126: ound was called and the last person
- Page 127 and 128: the domestic economy where the Inte
- Page 129 and 130: The proportion of people who play f
- Page 131 and 132: went on to beat out 838 other conte
- Page 133 and 134: in September, 2013. Massachusetts,
- Page 135 and 136: a comprehensive licensing process d
- Page 137 and 138: proposed legislation; strategic pla
- Page 139 and 140: must submit fingerprint cards and p
- Page 141 and 142: c. Charitable BingoSection 849.0931
- Page 143 and 144: 2. Regulation in Other StatesSpectr
- Page 145 and 146: holding of relevant hearings. 317 T
- Page 147 and 148: Figure 35: Ohio gaming regulatory s
- Page 149 and 150: Figure 37: New Jersey gaming regula
- Page 151 and 152: monthly reconciliation is done of t
- Page 153 and 154: Some of the most critical of those
- Page 155 and 156: Investigations. Casino regulatory a
- Page 157 and 158: equirements. The multi-jurisdiction
- Page 159 and 160: of the legality of these cafes has
- Page 161 and 162: many, are card cheats at table game
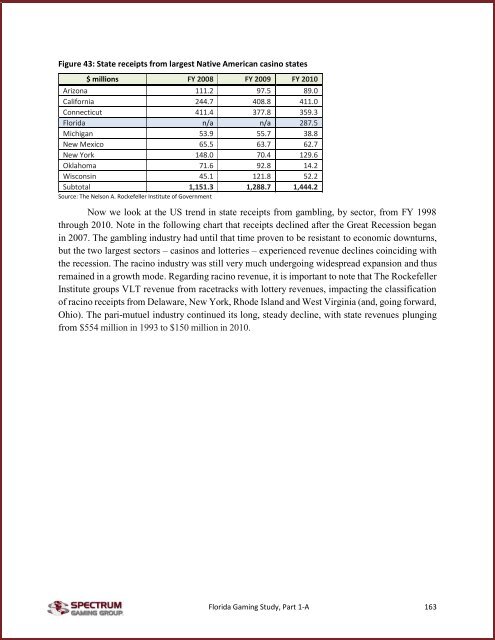
- Page 163 and 164: Optimizing financial benefit to the
- Page 165 and 166: 1985. 357 The matter was summarized
- Page 167 and 168: To whatever extent is reasonable an
- Page 169 and 170: conservator has a fiduciary respons
- Page 171 and 172: According to the grand jury, the hi
- Page 173 and 174: F. Gambling as Public Funding Sourc
- Page 175: MillionsNew YorkPennsylvaniaFLORIDA
- Page 179 and 180: Gamblingrevenue as shareof share of
- Page 181 and 182: Direct casino-revenue taxes, in bil
- Page 183 and 184: Many state and local governments ar
- Page 185 and 186: literature shows that communities w
- Page 187 and 188: pathology that exists on its own or
- Page 189 and 190: increase service levels. They may a
- Page 191 and 192: PA, after the Sands Casino Resort o
- Page 193 and 194: immigrant workers attracted to casi
- Page 195 and 196: acceptable. 420 From these results
- Page 197 and 198: uild a house and make a profit. Unl
- Page 199 and 200: leave a community less well off tha
- Page 201 and 202: increase by 90 percent (to 1.9 perc
- Page 203 and 204: crime, depending on the types of ga
- Page 205 and 206: seems obvious. If one is accumulati
- Page 207 and 208: has any involvement in the industry
- Page 209 and 210: trend in bankruptcies coincided wit
- Page 211 and 212: Nevertheless, there is solid anecdo
- Page 213 and 214: friendship/ family loss, and the ps
- Page 215 and 216: - like its counterparts in other st
- Page 217 and 218: Solution:As the American Psychiatri
- Page 219 and 220: Further, self-exclusion is intended
- Page 221 and 222: 1990 through 2010. The analysis ind
- Page 223 and 224: 4. Gambling-Specific vs. Non-Gambli
- Page 225 and 226: that would likely not have consider
- Page 227 and 228:
Year-over-year chainges in Las Vega
- Page 229 and 230:
Figure 51: Review of literature on
- Page 231 and 232:
that do not. 518 Cotti finds that,
- Page 233 and 234:
that have been performed suggest th
- Page 235 and 236:
casinos. In 2012, among all states
- Page 237 and 238:
among local residents. 539 Dubuque
- Page 239 and 240:
eyond its own amenities to establis
- Page 241 and 242:
III. Economic Assessment of Florida
- Page 243 and 244:
Avg. Number of SlotsAvg. Slot Rev.
- Page 245 and 246:
Paid AttendanceHandle, in millions1
- Page 247 and 248:
Paid Attendance19901991199219931994
- Page 249 and 250:
Handle and purses, inmillionse. Qua
- Page 251 and 252:
Handle, in millionsPaid Attendance1
- Page 253 and 254:
Avg. Number of Gaming Positions5,48
- Page 255 and 256:
the Educational Enhancement Trust F
- Page 257 and 258:
Figure 71: Past, present, future ec
- Page 259 and 260:
egulatory costs (in total) for pari
- Page 261 and 262:
up only a fraction of their total r
- Page 263 and 264:
& salary, tax revenue, as well as F
- Page 265 and 266:
Fast forward to 2012, by which time
- Page 267 and 268:
employment instead of adding to it)
- Page 269 and 270:
Figure 89 shows the private non-far
- Page 271 and 272:
Figure 93 above provides a breakdow
- Page 273 and 274:
Figure 98: Top 12 Florida industrie
- Page 275 and 276:
such as Retail Trade, Food Services
- Page 277 and 278:
Figure 105: Lottery forecastLottery
- Page 279 and 280:
Figure 111: Average annual employme
- Page 281 and 282:
Figure 115: Economic and fiscal imp
- Page 283 and 284:
Figure 119: Top 12 Florida industri
- Page 285 and 286:
Figure 123: Average annual employme
- Page 287 and 288:
Figure 127: Economic and fiscal imp
- Page 289 and 290:
Figure 131: Top 12 Florida industri
- Page 291 and 292:
Figure 135: Average annual employme
- Page 293 and 294:
3. Results - Strong Economic Growth
- Page 295 and 296:
Figure 143: Top 12 Florida industri
- Page 297 and 298:
Figure 147: Average annual employme
- Page 299 and 300:
Figure 151: Economic and fiscal imp
- Page 301 and 302:
Figure 155: Top 12 Florida industri
- Page 303 and 304:
Figure 159: Employment by demand so
- Page 305 and 306:
Figure 162: Summary of employment;
- Page 307 and 308:
Millions of fixed (2012) dollarsMil
- Page 309 and 310:
eveals them to be largely the same,
- Page 311 and 312:
Ohio Senate Oversight Committee Pen
- Page 313 and 314:
Last First Affiliation Title DateFo
- Page 315 and 316:
Appendix II: REMI Tax-PI Fiscal and
- Page 317 and 318:
industry, demographic, demand, and
- Page 319 and 320:
Block 1. Output and DemandThis bloc