Part 2 | The <strong>Top</strong> <strong>100</strong>RegionsRegionsAsia up, Latam down,Other regions moderateAlmost half of the brands in the<strong>BrandZ</strong> <strong>Top</strong> <strong>100</strong> ranking are basedin North America. They account fortwo-thirds of the <strong>Top</strong> <strong>100</strong>’s $2.6 trillionin brand value. Brand value growth inNorth America was flat, however.Growth rates fluctuated by region: Asia,Continental Europe, Latin America,North America and the UK. The BRICmarkets drove the greatest swings, withthe <strong>Top</strong> 10 brands from Asia up 13percent in brand value, while the Latam<strong>Top</strong> 10 declined 13 percent. The keyreasons for the contrast in growths ratesacross regions were:Strong individual brand performancesin China, despite a slower nationaleconomic growth rate, and brandgrowth in Korea, Japan and Australia;The slowdown of the Brazilian economyand the impact of governmentpolicy on strategic categories,including energy and banking; andModest growth in the value of leadingtechnology brands based in NorthAmerica, relative to prior yearsIn addition, the resilience of luxury andapparel brands based in ContinentalEurope balanced the overall impact ofthe region’s troubled economies. And acouple of global banks based in the UKimproved sharply in brand value.Asia appreciates in brand valueMany of China’s leading brandscontinued to appreciate in brand value,despite the slowdown in the rate ofeconomic growth. The country’s mostvaluable brand, China Mobile increased18 percent in brand value. China Mobilewon more 3G subscribers than its rivalswith its aggressive marketing. It is alsoexpanding its 4G network.Tencent, with a 52 percent rise in brandvalue, continued to draw more users toits instant messaging service and otherofferings. The success of its Galaxysmartphones drove the improved 51percent in Samsung’s brand value andburnished the Korean brand across itswide range of home appliances anddigital devices.Toyota reclaimed the number one positionin the <strong>BrandZ</strong> car category ranking,suggesting that the Japanese brand hasrecovered from the product recall crisisof 2009. The presence of two Australianbanks, Commonwealth and ANZ, reflectsthe country’s economic strength relativeto other developed markets.Latam declines in brand valueThe brand value decline by the <strong>Top</strong> 10Latam brands resulted from the impactof the troubled Brazilian economy andthe government’s response with policiesaimed at expanding the middle class andcontrolling inflation.These factors negatively impactedPetrobras, the government-controlled oiland gas company, and major Brazilianbank brands, including Bradesco andItaù. At the same time, governmentpolicies to stimulate spending helpedconsumer products. The Brazilian beerSkol increased 39 percent in brand value.Corona, the Mexican beer, improved 29percent in brand value. In addition, twoColombian brands entered the <strong>BrandZ</strong>category rankings for the first time, thebeer brand Aquila and Ecopetrol, an oiland gas brand.Continental Europe and the UKexperience modest growthDespite economic problems across thecontinent, the <strong>Top</strong> 10 brands based inEurope increased 5 percent in brandvalue, in part on the strength of apparel.Fast fashion apparel brand Zaraimproved 60 percent.In a year when the technology categoryimproved only modestly in overallbrand value, Germany-based SAPappreciated 34 percent as the businessto-businesssector recovered and SAPintroduced solutions for using big datafor enterprise transformation.The 4 percent brand value rise in by <strong>Top</strong>10 UK-based brands resulted primarilyfrom the financial rebound of banking.Barclays, with a 34 percent rise in brandvalue, worked to restore trust. Improving24 percent in brand value, HSBCrefocused on developing its profitableinternational trade business.North America up slightlyThe <strong>Top</strong> 10 North American brands arealso the <strong>BrandZ</strong> <strong>Top</strong> 10 <strong>Most</strong> <strong>Valuable</strong><strong>Global</strong> <strong>Brands</strong>, with one exception. GEappears at number 11 in the <strong>BrandZ</strong><strong>Top</strong> <strong>100</strong>, following China Mobile, in tenthplace with a slightly higher brand value.The collective brand value of the NorthAmerican <strong>Top</strong> 10 totals over $900 billion.Although these large and stable brandsimproved a modest 2 percent in brandvalue, 2 percent of almost $1 trillion is alot of brand value.Some of the more recent arrivals likeApple (established in 1976) and Google(established in 1998) grew so quicklythat their brand value growth isbeginning to resemble the pace of a moremature brand.That said, GE (established in 1892)grew 21 percent in brand value becauseof the strength of the brand and recoveryin some of its key industries, such as jetengines, with strong demand from fastgrowing markets.<strong>Top</strong> 10 North AmericaBrandNorth American brandsdominate in number, valueAlmost half of the brands in the <strong>BrandZ</strong> <strong>Top</strong> <strong>100</strong> ranking are basedin North America. They account for two-thirds of the <strong>Top</strong> <strong>100</strong>’s $2.6trillion in brand value. Just less than one-quarter of the <strong>BrandZ</strong> <strong>Top</strong><strong>100</strong> brands are based in Asia, and they total 17 percent of the <strong>Top</strong> <strong>100</strong>total brand value.<strong>Top</strong> <strong>100</strong> <strong>Brands</strong>by RegionAfricaAsiaEuropeNorth AmericaUKBrand value2013 $M47%7%1%Brandcontribution23%22%Brand value change2013 vs 2012Rankchange1 Apple 185,071 4 1% 02 Google 113,669 3 5% 13 IBM 112,536 3 -3% -14 McDonald’s 90,256 4 -5% 05 Coca-Cola 78,415 5 6% 16 AT&T 75,507 3 10% 27 Microsoft 69,814 3 -9% -28 Marlboro 69,383 3 -6% -19 Visa 56,060 4 46% New10 GE 55,357 2 21% 0Valuations include data from <strong>BrandZ</strong>, Kantar Worldpanel, Kantar Retail and Bloomberg.Brand Contribution measures the influence of brand alone on earnings, on a scale of 1 to 5 (5 highest).Up 2%<strong>Top</strong> <strong>100</strong> <strong>Brands</strong>by Value ShareAfricaAsiaEuropeNorth AmericaUKSome of the morerecent arrivals likeApple and Googlegrew so quicklythat their brandvalue growthis beginning toresemble thepace of a moremature brand65%5%0%17%13%36 <strong>BrandZ</strong> <strong>Top</strong> <strong>100</strong> <strong>Most</strong> <strong>Valuable</strong> <strong>Global</strong> <strong>Brands</strong> 201337
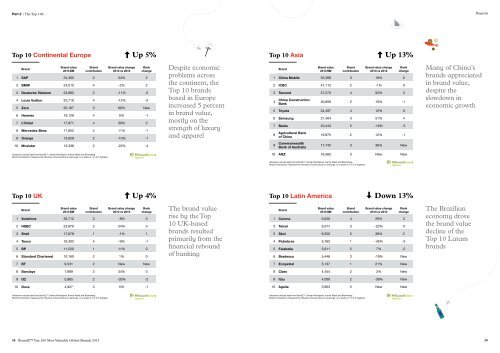
Part 2 | The <strong>Top</strong> <strong>100</strong>Regions<strong>Top</strong> 10 Continental EuropeUp 5%<strong>Top</strong> 10 AsiaUp 13%BrandBrand value2013 $MBrandcontributionBrand value change2013 vs 2012Rankchange1 SAP 34,365 2 34% 22 BMW 24,015 4 -2% 23 Deutsche Telekom 23,893 2 -11% -24 Louis Vuitton 22,719 4 -12% -25 Zara 20,167 3 60% New6 Hermès 19,129 4 0% -17 L’Oréal 17,971 4 30% 28 Mercedes-Benz 17,952 4 11% -19 Orange 13,829 2 -10% -110 Movistar 13,336 2 -22% -4Despite economicproblems acrossthe continent, the<strong>Top</strong> 10 brandsbased in Europeincreased 5 percentin brand value,mostly on thestrength of luxuryand apparelBrandBrand value2013 $MBrandcontributionBrand value change2013 vs 2012Rankchange1 China Mobile 55,368 3 18% 02 ICBC 41,115 2 -1% 03 Tencent 27,273 4 52% 34China ConstructionBank26,859 2 10% -15 Toyota 24,497 4 12% 06 Samsung 21,404 3 51% 47 Baidu 20,443 5 -16% -38Agricultural Bankof China9 CommonwealthBank of Australia19,975 2 12% -117,745 3 36% NewMany of China’sbrands appreciatedin brand value,despite theslowdown ineconomic growthValuations include data from <strong>BrandZ</strong>, Kantar Worldpanel, Kantar Retail and Bloomberg.Brand Contribution measures the influence of brand alone on earnings, on a scale of 1 to 5 (5 highest).10 ANZ 16,565 3 New NewValuations include data from <strong>BrandZ</strong>, Kantar Worldpanel, Kantar Retail and Bloomberg.Brand Contribution measures the influence of brand alone on earnings, on a scale of 1 to 5 (5 highest).<strong>Top</strong> 10 UKUp 4%<strong>Top</strong> 10 Latin AmericaDown 13%BrandBrand value2013 $MBrandcontributionBrand value change2013 vs 2012Rankchange1 Vodafone 39,712 3 -8% 02 HSBC 23,970 3 24% 03 Shell 17,678 1 -1% 14 Tesco 16,303 4 -9% -15 BP 11,520 1 11% 06 Standard Chartered 10,160 2 1% 0The brand valuerise by the <strong>Top</strong>10 UK-basedbrands resultedprimarily from thefinancial reboundof bankingBrandBrand value2013 $MBrandcontributionBrand value change2013 vs 2012Rankchange1 Corona 6,620 4 29% 32 Telcel 6,577 3 -22% 03 Skol 6,520 5 39% 24 Petrobras 5,762 1 -45% -35 Falabella 5,611 5 7% -26 Bradesco 5,446 3 -19% NewThe Brazilianeconomy drovethe brand valuedecline of the<strong>Top</strong> 10 Latambrands7 BT 9,531 2 New New7 Ecopetrol 5,137 1 21% New8 Barclays 7,989 2 34% 08 Claro 4,454 2 3% New9 O2 5,965 2 -30% -29 Itau 4,006 2 -39% New10 Dove 4,927 3 5% -110 Aguila 3,903 5 New NewValuations include data from <strong>BrandZ</strong>, Kantar Worldpanel, Kantar Retail and Bloomberg.Brand Contribution measures the influence of brand alone on earnings, on a scale of 1 to 5 (5 highest).Valuations include data from <strong>BrandZ</strong>, Kantar Worldpanel, Kantar Retail and Bloomberg.Brand Contribution measures the influence of brand alone on earnings, on a scale of 1 to 5 (5 highest).38 <strong>BrandZ</strong> <strong>Top</strong> <strong>100</strong> <strong>Most</strong> <strong>Valuable</strong> <strong>Global</strong> <strong>Brands</strong> 201339