A Review of Properties and Variations of Voronoi Diagrams
A Review of Properties and Variations of Voronoi Diagrams
A Review of Properties and Variations of Voronoi Diagrams

Create successful ePaper yourself
Turn your PDF publications into a flip-book with our unique Google optimized e-Paper software.
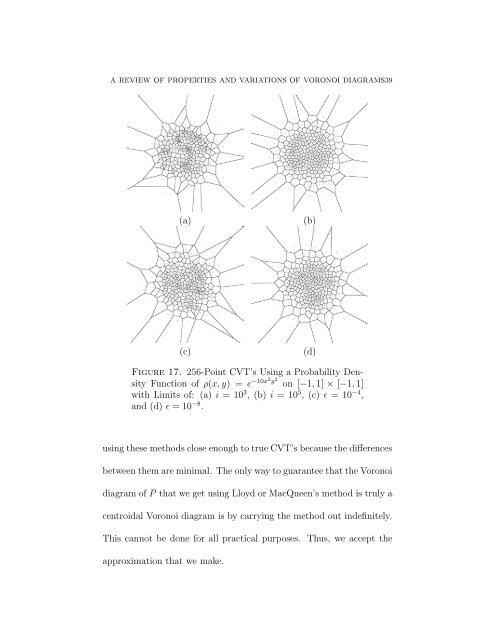
A REVIEW OF PROPERTIES AND VARIATIONS OF VORONOI DIAGRAMS39(a)(b)(c)(d)Figure 17. 256-Point CVT’s Using a Probability DensityFunction <strong>of</strong> ρ(x, y) = e −10x2 y 2 on [−1, 1] × [−1, 1]with Limits <strong>of</strong>: (a) i = 10 3 , (b) i = 10 5 , (c) ɛ = 10 −4 ,<strong>and</strong> (d) ɛ = 10 −8 .using these methods close enough to true CVT’s because the differencesbetween them are minimal. The only way to guarantee that the <strong>Voronoi</strong>diagram <strong>of</strong> P that we get using Lloyd or MacQueen’s method is truly acentroidal <strong>Voronoi</strong> diagram is by carrying the method out indefinitely.This cannot be done for all practical purposes. Thus, we accept theapproximation that we make.