The State of Europe's Common Birds 2008 - European Bird Census ...
The State of Europe's Common Birds 2008 - European Bird Census ...
The State of Europe's Common Birds 2008 - European Bird Census ...

Create successful ePaper yourself
Turn your PDF publications into a flip-book with our unique Google optimized e-Paper software.
<strong>The</strong> <strong>State</strong> <strong>of</strong> Europe’s <strong>Common</strong> <strong><strong>Bird</strong>s</strong> <strong>2008</strong>THE STATE OF EUROPE’SCOMMON BIRDS<strong>2008</strong>1
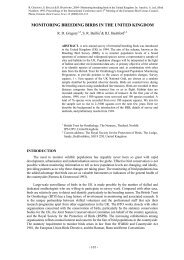
<strong>The</strong> <strong>State</strong> <strong>of</strong> Europe’s <strong>Common</strong> <strong><strong>Bird</strong>s</strong> <strong>2008</strong><strong>The</strong> long-term trend <strong>of</strong> Winter Wren Troglodytes troglodytes shows a moderate increase,although there are marked fluctuations, probably in reaction to severe winters.Photo by D. Jirovský (wildbirdphoto.eu)AcknowledgementsSpecial thanks go to the many thousands <strong>of</strong> skilled volunteer surveyors responsiblefor data collection in many <strong>European</strong> countries.For valuable comments, help with data collation and analysis and general support, thanks to A. Anselin, A. Brunner,L. Buvoli, P. Chylarecki, D. Coombes, L. Costa, A. Derouaux, M. Dvorak, M. Flade, D. W. Gibbons, A. Gmelig Meyling,M. Grell, H. Herpoel, S. Herrando, J.-P. Jacob, V. Keller, T. Kinet, A. Kuresoo, D. Leitao, R. Martí, A. Meirinho, M. Raven,D. Richard, N. Schäffer, H. Sierdsema, S. Svensson, J. Tavares, T. Telenský, A. Teller, J. Tiainen, A. Van Strien,Z. Vermouzek, Z. Waliczky, S. Wotton and N. Zbinden.PECBMS is a joint initiative <strong>of</strong> the <strong>European</strong> <strong>Bird</strong> <strong>Census</strong> Council (EBCC) and the <strong>Bird</strong>LifeInternational. It has been supported financially since 2002 by the Royal Society for Protection <strong>of</strong> <strong><strong>Bird</strong>s</strong>(RSPB, the <strong>Bird</strong>Life International Partner in the UK), and since January 2006 by the <strong>European</strong>Commission and RSPB. Sole responsibility for the contents <strong>of</strong> this report lies with the authors;the <strong>European</strong> Commission is not responsible for any use that may be made <strong>of</strong> the informationcontained in this document.Other significant PECBMS partners include Statistics Netherlands, Czech Society for Ornithology (CSO, the <strong>Bird</strong>LifeInternational Partner in the Czech Republic), British Trust for Ornithology (BTO) and Dutch Organisation for FieldOrnithology (SOVON).Authors: A. Klvaňová, P. Voříšek, R.D. Gregory, I.J. Burfield, J. Škorpilová, A. Auninš, E. de Carli, O. Crowe,J. C. del Moral, J. Elts, V. Escandell, R.P.B. Foppen, L. Fornasari, H. Heldbjerg, G. Hilton, M. Husby, D. Jawinska, F. Jiguet,A. Joys, Å. Lindström, R. Martins, D.G. Noble, J. Reif, H. Schmid, J. Schwarz, S. Spasov, T. Szép, N. Teufelbauer,R. A. Väisänen, Ch. Vansteenwegen, A. Weiserbs.Abbreviated citation: PECBMS (2009). <strong>The</strong> <strong>State</strong> <strong>of</strong> Europe’s <strong>Common</strong> <strong><strong>Bird</strong>s</strong> <strong>2008</strong>. CSO/RSPB, Prague, Czech Republic.Layout: J. Kaláček. Printed by JAVA Třeboň, Czech Republic.Cover photo: Northern Lapwing Vanellus vanellus by T. Bělka (birdphoto.cz).2
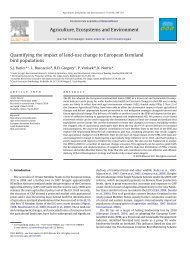
<strong>The</strong> <strong>State</strong> <strong>of</strong> Europe’s <strong>Common</strong> <strong><strong>Bird</strong>s</strong> <strong>2008</strong>Summary• This report presents the combined populationtrends <strong>of</strong> 135 common bird species based ondata collected from 21 <strong>European</strong> countries,covering the period 1980–2006. Comparedto earlier reports in this series, the reliability<strong>of</strong> the results has improved due to enhanceddata quality control and increasedgeographical coverage.• Of the 135 species covered, 36 have increasedmoderately and one strongly, 53 have declinedmoderately and two steeply, while 29 haveremained stable. In only 14 cases do speciestrends remain uncertain.• 36 species were classified as farmland birds,<strong>of</strong> which 20 declined, seven increased, fourremained stable and five were classified asuncertain.• 29 species were classified as forest birds,<strong>of</strong> which 12 declined, six increased, nineremained stable and two were classified asuncertain.• <strong>The</strong> numbers <strong>of</strong> common forest birds havedeclined on average by 9%, but there areregional differences. Those in eastern andwestern Europe have remained relativelystable, but those in northern and possiblysouthern Europe have shown steep declines.• <strong>The</strong> wild bird indicators produced byPECBMS are successfully used by policymakers as <strong>of</strong>ficial biodiversity indicators inEurope. For example, the Farmland <strong>Bird</strong>Indicator (FBI) has been adopted by the EUas a Structural Indicator, a SustainableDevelopment Indicator, and a baselineindicator for monitoring the implementation<strong>of</strong> the Rural Development Regulation underthe <strong>Common</strong> Agricultural Policy (CAP).• SEBI2010 (Streamlining <strong>European</strong> 2010Biodiversity Indicators), a pan-<strong>European</strong>initiative led by the <strong>European</strong> EnvironmentAgency, has also incorporated the wild birdindicators in a set <strong>of</strong> 26 indicators to assessprogress towards the <strong>European</strong> target <strong>of</strong>halting biodiversity loss by 2010.• <strong>The</strong> other 70 species were classified as ‘othercommon birds’, and included generalists andspecialists <strong>of</strong> other habitats. Of these, 23declined, 24 increased, 16 remained stableand seven were classified as uncertain.• <strong>Common</strong> birds as a whole are still inmoderate decline in Europe. Averagepopulation levels have fallen by 10%over the last 26 years.• <strong>The</strong> numbers <strong>of</strong> common farmland birds haveon average fallen by 48%. Although thedecline appears to have levelled <strong>of</strong>f in recentyears, Europe has still lost half <strong>of</strong> its farmlandbirds in the last quarter <strong>of</strong> a century.Furthermore, there are signs that the largedeclines witnessed in the old EU Member<strong>State</strong>s may now be repeated in the newMember <strong>State</strong>s. <strong>The</strong>se losses must be reversedand prevented, respectively.Eurasian Tree Sparrow Passer montanuspopulations showed a moderate decline in the1980s as did its more common relative, HouseSparrow Passer domesticus. However, the formerspecies has been stable more recently, while thelatter has continued to decline.Photo by D. Jirovský (wildbirdphoto.eu)3
<strong>The</strong> <strong>State</strong> <strong>of</strong> Europe’s <strong>Common</strong> <strong><strong>Bird</strong>s</strong> <strong>2008</strong>Photo by D. Boucný (birdphoto.cz)Ortolan Bunting Emberiza hortulana is decreasing steeply across much <strong>of</strong> Europe.IntroductionThis is the third report in a series describing thehealth <strong>of</strong> common bird populations in Europe,brought together by the Pan-<strong>European</strong> <strong>Common</strong><strong>Bird</strong> Monitoring Scheme (PECBMS). It presentsthe population trends <strong>of</strong> 135 bird species, as wellas multi-species indices (indicators), based ondata from 21 annually operated nationalbreeding bird surveys spanning the period from1980 to 2006. With more countries contributingtheir data, and improvements in data qualitycontrol, the results are now more representativeand more precise than before. In fact, thenumber <strong>of</strong> common terrestrial species that it ispossible to monitor using generic samplingsurveys in the breeding season is probablynearing its maximum. To expand further andproduce relevant <strong>European</strong> trends and indicesfor more species, PECBMS would need toextend its remit and collate data on rarer species,for example from species-specific surveys.Over the last few years, the indicatorsproduced by PECBMS have been usedincreasingly widely for policy purposes, both at<strong>European</strong> and national levels, illustrating therelevance <strong>of</strong> the indicators. <strong>The</strong> aim is to helppolicy makers understand changes in theenvironment and then make more informeddecisions about the management <strong>of</strong> naturalresources. Furthermore, the underlyinginformation on individual species trends has itsown value. <strong>The</strong>se data can be used inData | <strong>The</strong> data are derivedfrom annually operated breeding birdsurveys in 21 <strong>European</strong> countries,spanning different time periods(see www.ebcc.info/pecbm.html),coordinated through the PECBMS.assessments <strong>of</strong> species’ conservation status, toexplore the effects <strong>of</strong> driving forces at differentspatial and temporal scales, and to trigger moredetailed research into the reasons underlyingspecies’ population changes.This report not only presents the latest update<strong>of</strong> the wild bird indicators, but also describes theuse <strong>of</strong> the indicators for policy purposes and forscientific research. It also summarises the state<strong>of</strong> knowledge about common bird populationchanges, and indicates the direction <strong>of</strong> currentand future research.Indicators<strong>The</strong> latest set <strong>of</strong> wild bird indicators shows whatis happening to many species that are consideredas common and widespread across Europe. Whilemany rare and localised bird species havebenefited from special protection under the EU<strong><strong>Bird</strong>s</strong> Directive and the Natura 2000 network(Donald et al. 2007), many common species havecontinued to decline. Overall, the numbers <strong>of</strong> allcommon birds declined by around 10% between1980 and 2006 (see Figure 1).4
<strong>The</strong> <strong>State</strong> <strong>of</strong> Europe’s <strong>Common</strong> <strong><strong>Bird</strong>s</strong> <strong>2008</strong>Map 1 | Countriescontributing their datato PECBMS.<strong>The</strong> numbers in parenthesesshow the first year <strong>of</strong> data provided by eachnational survey: Austria (1998), Belgium (1990),Bulgaria (2004), Czech Republic (1982), Denmark(1976), Estonia (1983), Finland (1975), France(1989), Germany (1989), Hungary (1999),Ireland (1998), Italy (2000), Latvia (1995),Netherlands (1990), Norway (1995), Poland(2000), Portugal (2004), Spain (1996),Sweden (1975), Switzerland (1999),United Kingdom (1966). Data fromthe relatively new scheme inBulgaria, which started in 2004, areincluded for the first time. Moreover, thedata from Estonia now cover a longer timeperiod (1983–2006) and more speciescompared with the previous version (PECBMS2007). Data from Belgium comefrom two regional monitoringschemes in Wallonia andBrussels, covering the period1990–2005; data from thewhole <strong>of</strong> Belgium areexpected to becomeavailable in the near future.As well as increased geographical coverage,data quality control has been also improved.Data quality is controlled at two main levels:(1) species; and (2) multi-species indices (indicators).(1) To produce a <strong>European</strong> species index, datashould first be available from countries whichtogether host at least 50% <strong>of</strong> ‘PECBMS <strong>European</strong>’population <strong>of</strong> a species. ‘PECBMS Europe’ includesthose countries which already provide their data, aswell as those which are actively involved in theproject and expect to provide their data by 2010 (forthe full list <strong>of</strong> the countries, see http://www.ebcc.info/index.php?ID=362). Second, each nationalspecies trend is inspected to confirm whether itreliably reflects real population changes. Thisprocedure involves assessing statisticalcharacteristics, such as slope value and its standarderror, index value and its standard error, and theproportion <strong>of</strong> each species’ national populationcovered by the monitoring scheme. It alsoinvolves consulting with the coordinators <strong>of</strong> thenational monitoring schemes (for more details, seehttp://www.ebcc.info/index.php?ID=362).(2) Confidence limits and extent <strong>of</strong> fluctuations ina species’ index are used to assess whether a speciesshould be included in an indicator. Indices with lowprecision and large fluctuations are examined indetail (for more details, see http://www.ebcc.info/index.php?ID=362).Although stricter criteria have been applied, theresulting indicators are consistent with the previousversions published in 2007, thereby confirming therobustness <strong>of</strong> the indicators. For more details onmethods, data quality control and speciesclassification, see http://www.ebcc.info/index.php?ID=362 and http://www.ebcc.info/index.p?ID=301.5
<strong>The</strong> <strong>State</strong> <strong>of</strong> Europe’s <strong>Common</strong> <strong><strong>Bird</strong>s</strong> <strong>2008</strong><strong>Common</strong> farmland birds have undergone thelargest overall decrease in numbers. <strong>The</strong>irpopulations declined on average by 48% from1980 to 2006. Much <strong>of</strong> this decline took placebetween 1980 and the mid-1990s, since when thetrend appears to have levelled <strong>of</strong>f. However,inspection <strong>of</strong> the underlying species trends showsthat many farmland birds, particularly specialists,are still declining, while only a few species(mainly generalists) are increasing. Comparingtrends in old and new EU Member <strong>State</strong>s (i.e.those which joined the EU before or after 2004)highlights an important difference that becameevident during the early 1990s (see Figure 2). Atthat time, farmland birds in the old EU countriescontinued to decline, but populations in the newEU countries staged something <strong>of</strong> a recovery,most probably due to a return to less intensiveagriculture following the collapse <strong>of</strong>Communism. Since then, however, farmlandbirds have declined again in the new EUcountries, and they are now following a similartrajectory to those in the old EU countries.<strong>The</strong>re is a great deal <strong>of</strong> evidence to suggestthat the main factor driving changes in thesebird populations has been agriculturalintensification and specialisation, such as theloss <strong>of</strong> crop diversity, destruction <strong>of</strong> grasslandsand hedgerows, and increased use <strong>of</strong> pesticidesand fertilizers (Aebischer et al. 2000, Donald etal. 2001, Newton 2004). However, the causes <strong>of</strong>farmland bird population changes and relativeimportance <strong>of</strong> individual driving forces mayvary across Europe (e.g. Reif et al. <strong>2008</strong>, Henleet al. <strong>2008</strong>). For example, there are signals fromsome southern and eastern <strong>European</strong> countriessuggesting that while farmland species aredeclining due to intensification in some areas,in others they are suffering from habitat losscaused by abandonment and succession,whereby formerly extensively farmed landhas gradually been replaced by scrub andwoodland (e.g. Sirami et al. <strong>2008</strong>).If we consider the farmland bird indicatorfrom a regional perspective, a more pronounceddecline is apparent in all regions (see Figure 3).<strong>The</strong> indicator shows that northern Europe, likewestern Europe, now holds only half as manyFigure 1 | <strong>The</strong> wild bird indicators for Europe.<strong>The</strong> numbers in parentheses show the numbers<strong>of</strong> species in each indicator.farmland birds as in 1980. In Sweden, forexample, a combination <strong>of</strong> intensification andabandonment, as well as the simultaneous loss <strong>of</strong>landscape heterogeneity and factors operatingon the wintering grounds, have all beenimplicated in the steep decline <strong>of</strong> farmland birds(Wretenberg et al. 2006).<strong>The</strong> equivalent figures for common forest birdpopulations show that they continue to declinemoderately. On average, they have fallen innumbers by 9% from 1980 to 2006. Differencesbetween regions are apparent (see Figure 4).While in western, central and eastern Europe theforest birds remain stable, a pronounceddecrease <strong>of</strong> their populations is obvious in theFigure 2 | <strong>The</strong> farmland bird indicator for the Old EUMember <strong>State</strong>s (Austria, Belgium, Denmark, Finland,France, Germany, Ireland, Italy, Netherlands, Portugal,Spain, Sweden, UK) and New EU Member <strong>State</strong>s,which joined the EU in 2004 or 2007 (Bulgaria,Czech Republic, Estonia, Hungary, Latvia, Poland).<strong>The</strong> numbers in parentheses show the numbers<strong>of</strong> species in each indicator.6
<strong>The</strong> <strong>State</strong> <strong>of</strong> Europe’s <strong>Common</strong> <strong><strong>Bird</strong>s</strong> <strong>2008</strong>Figure 3 | Regional indicators <strong>of</strong> common farmlandbirds in four <strong>European</strong> regions. Countries contributingtheir data are grouped as follows: North Europe: Finland,Norway, Sweden; West Europe: Austria, Belgium,Denmark, former West Germany, Ireland, Netherlands,Switzerland, United Kingdom; South Europe: France,Italy, Portugal, Spain; Central and East Europe: CzechRepublic, Estonia, former East Germany, Hungary, Latvia,Poland. <strong>The</strong> numbers in parentheses show the numbers<strong>of</strong> species in each indicator.Figure 4 | Regional indicators <strong>of</strong> common forest birds infour <strong>European</strong> regions. Countries contributing their dataare grouped as follows: North Europe: Finland, Norway,Sweden; West Europe: Austria, Belgium, Denmark, formerWest Germany, Ireland, Netherlands, Switzerland, UnitedKingdom; South Europe: France, Italy, Portugal, Spain;Central and East Europe: Czech Republic, Estonia, formerEast Germany, Hungary, Latvia, Poland. <strong>The</strong> numbers inparentheses show the numbers <strong>of</strong> species in eachindicator.Photo by T. Bělka (birdphoto.cz)north and south Europe. <strong>The</strong> driving forcesbehind these declines are rather uncertain, but itis thought that intensive forestry exploitationmay threaten some northern forest birds. Insouthern Europe, the trends are more uncertainbut wild fires and unregulated logging might beinvolved.White Stork Ciconia ciconia started to recoverin the 1990s after large declines during the 20thcentury caused by both breeding and foraginghabitat losses induced by modern agriculturepractices and negative conditions on thewintering sites. <strong>The</strong>se declines provokedreintroduction programmes in several <strong>European</strong>countries. However, we should continue to payattention to White Stork, as the trend in easternEurope shows a moderate decline in recent years.7
<strong>The</strong> <strong>State</strong> <strong>of</strong> Europe’s <strong>Common</strong> <strong><strong>Bird</strong>s</strong> <strong>2008</strong>Species trendsTrends for 135 bird species were produced in <strong>2008</strong>.According to the species trend classification,which takes into account the precision <strong>of</strong> trendestimates (see Box 1 on page 17), almost half <strong>of</strong>the species have been stable or have increased(49%) and 41% have declined. Trends <strong>of</strong> theremaining 10% <strong>of</strong> species were classified asuncertain. See Figures 5 and 6 for details.Figure 5 | Data for 109 species were available toproduce long-term trends (time period from 1980 or1982 to 2006). Of these, 48 (43%) declined moderatelyand two (2%) steeply, while 30 (28%) increasedmoderately and 24 (22%) were stable. Only five (5%)species’ trends were classified as uncertain.Several farmland species have suffered some <strong>of</strong>the best documented declines in Europe (seeFigure 7 for their comparison). <strong>The</strong>re is goodevidence that the widespread decline (seeFigure 8) <strong>of</strong> the Grey Partridge Perdix perdix hasbeen caused by agricultural intensification, whichhas altered the species’ breeding and feedinghabitats (Aebischer and Kavanagh 1997). <strong>The</strong> use<strong>of</strong> fungicides and herbicides on cereal fieldsreduces the abundance <strong>of</strong> insects as food andresults in lower chick survival (Rands 1985). <strong>The</strong>quality <strong>of</strong> insect food is also important for chicksurvival: the proportion <strong>of</strong> aphids in the cerealarthropod fauna has increased since theintroduction <strong>of</strong> herbicides, with negativeconsequences for chick growth (Borg and T<strong>of</strong>t2000). Predation is an important cause <strong>of</strong> adultGrey Partridge mortality, especially during thenesting period (e. g. Tapper et al. 1996), and it hasbeen suggested that the abundance <strong>of</strong> predators isalso linked with changes in habitat management(Bro et al. <strong>2008</strong>). Survival rates over the winter arealso important demographic influences onpopulation growth rate (Bro et al. 2000).Figure 7 | <strong>European</strong> trends <strong>of</strong> three farmlandspecies that have shown some <strong>of</strong> the largest and bestdocumented declines in Europe (see Table 1).Figure 6 | Data for all 135 species were available toproduce short-term trends (with the starting yearranging from 1990 to 2004). For 14 <strong>of</strong> these species(10%), the trend was classified as uncertain, reflectingthe current lack <strong>of</strong> sufficiently long time series.29 species (21%) increased moderately, while 43 speciesdeclined moderately (32%) and one (1%) steeply. <strong>The</strong>largest proportion <strong>of</strong> species (48; 36%) remained stable.<strong>The</strong> decline <strong>of</strong> the <strong>European</strong> Turtle-doveStreptopelia turtur at least partly reflects changesin agricultural practice, which have reduced thequantity and variety <strong>of</strong> wildflowers on arableland (Marchant et al. 1990). <strong>The</strong> loss <strong>of</strong>8
<strong>The</strong> <strong>State</strong> <strong>of</strong> Europe’s <strong>Common</strong> <strong><strong>Bird</strong>s</strong> <strong>2008</strong>Photo by Z. Tunka (birdphhoto.cz)hedgerows and thickets on farmland is likely tohave had an adverse effect on the population.<strong>The</strong> loss <strong>of</strong> hedgerows and thickets on farmlandis likely to have had an adverse effect on thepopulation <strong>of</strong> the <strong>European</strong> Turtle-doveStreptopelia turtur.Figure 8 | Regional trends <strong>of</strong> the Grey Partridge Perdixperdix in Europe. Countries contributing their data aregrouped as follows: West Europe: Austria, Belgium,Denmark, former West Germany, Netherlands, UnitedKingdom; South Europe: France; Central and East Europe:Czech Republic, former East Germany, Hungary, Poland.As a long-distance migrant, the <strong>European</strong>Turtle-dove faces threats on its migration routesand wintering areas. Hunting can be seen as anaggravating factor especially where it takes placein spring during migration and the reproductionperiod, as the species suffers from lowFigure 9 | Regional trends <strong>of</strong> the <strong>European</strong> Turtle-doveStreptopelia turtur in Europe. Countries contributingtheir data are grouped as follows: West Europe: Austria,Belgium, former West Germany, Netherlands, UnitedKingdom; South Europe: France, Italy, Portugal, Spain;Central and East Europe: Czech Republic, Estonia,former East Germany, Hungary, Latvia, Poland.9
<strong>The</strong> <strong>State</strong> <strong>of</strong> Europe’s <strong>Common</strong> <strong><strong>Bird</strong>s</strong> <strong>2008</strong>Photo by D. Boucný (birdphoto.cz)Drainage <strong>of</strong> wetlands and use <strong>of</strong> herbicidesare thought to have caused moderate decline<strong>of</strong> Yellow Wagtail Motacilla flava, a specieswhich prefers moist grassy habitats. It is alsopossible, that this migratory bird suffersincreasing mortality rates during migration,e.g. because <strong>of</strong> environmental degradation<strong>of</strong> the Sahel region.conversion to improved grassland has reducedthe availability <strong>of</strong> wet grassland, one <strong>of</strong> theNorthern Lapwing’s preferred nesting habitats(Taylor and Grant 2004). Increased predation <strong>of</strong>clutches on improved pastures largely accountsfor the reduced breeding success (Baines 1990).productivity and low adult and juvenilesurvivorship (Glutz and Jensen 2007).Attention must also be paid to possiblecompetition with the Eurasian Collared-dove,Streptopelia decaocto, which is expanding inEurope. Drought conditions and habitatdestruction in acacia scrub in the Sahel region,where <strong>European</strong> Turtle-doves spend part <strong>of</strong> theyear, have coincided with the decline in numbers(Jarry 1992). <strong>The</strong> regional differences in thespecies’ trend (see Figure 9) are probably causedby different migration routes and winteringareas <strong>of</strong> the populations and arable landmanagement in different parts <strong>of</strong> Europe.<strong>The</strong> numbers <strong>of</strong> the Northern LapwingVanellus vanellus have decreased all aroundEurope, yet with marked regional differences inthe timing and rate <strong>of</strong> decline (see Figure 10).Intensification <strong>of</strong> grassland systems is believedto be a causal factor in population declines <strong>of</strong>this species, which inhabits open grasslandhabitats and grazed meadows. <strong>The</strong> use <strong>of</strong>chemicals reduces the availability <strong>of</strong>invertebrates, while agricultural machinery andcattle trampling lead to high nest and fledglinglosses (Pakkala et al. 1997). Drainage andThis report also contains information oneleven species for which the data were sufficientto produce reliable <strong>European</strong> trends for the firsttime. Amongst these, the Eurasian Thick-kneeBurhinus oedicnemus has shown a moderateincrease since 1996, albeit with considerablefluctuations. This formerly more widespreadspecies underwent a large decline during 1970–1990 across much <strong>of</strong> Europe, due to habitat lossinduced by human activities (Nipkow 1997).<strong>The</strong> trend <strong>of</strong> this species is based on data fromFrance and Spain, the latter holds more than half<strong>of</strong> the <strong>European</strong> population, and is where thespecies shows some signs <strong>of</strong> recovery.Figure 10 | Regional trends <strong>of</strong> the Northern LapwingVanellus vanellus in Europe. Countries contributing theirdata are grouped as follows: West Europe: Austria,Denmark, former West Germany, Netherlands, UnitedKingdom; South Europe: France, Italy; Central and EastEurope: Czech Republic, Estonia, former East Germany,Hungary, Latvia, Poland; North Europe: Finland, Sweden.10
<strong>The</strong> <strong>State</strong> <strong>of</strong> Europe’s <strong>Common</strong> <strong><strong>Bird</strong>s</strong> <strong>2008</strong><strong>The</strong> Raven Corvus corax is increasing in numbers by around 3% per year. After a long period<strong>of</strong> persecution, the species has experienced a natural recolonisation process, assisted in some placesby reintroduction programmes (Bednorz 1997). While both long- (1980–2006) and short-termtrends (1990–2006) have shown a moderate increase, since 1995 the trend is classified as stable.For regional trends see Figure 11.Photo by T. Pospíšil (birdphoto.cz)Figure 11 | Regional trends <strong>of</strong> the Raven Corvus corax inEurope. Countries contributing their data are groupedas follows: North Europe: Finland, Norway, Sweden; WestEurope: Austria, former West Germany, Netherlands,Switzerland, United Kingdom; South Europe: France,Italy, Portugal, Spain; Central and East Europe: CzechRepublic, Estonia, former East Germany, Hungary,Poland.Among the species that have shown some <strong>of</strong>the greatest increases in Europe between 1980and 2006 is the Great Reed-warbler Acrocephalusarundinaceus, which has increased in abundanceby around 3.5% per year. It seems thatthe population decrease experienced during1970–1990 in many <strong>European</strong> countries hasbeen followed by a recovery, at least in severalcountries holding significant populations.As the population declines were explained by theoverall poor state <strong>of</strong> <strong>European</strong> inland wetlands(drainage, eutrophication, lower arthropoddensities, reduced plant density; Schulze-Hagen1997), we can assume at least some <strong>of</strong> theseparameters have improved.11
<strong>The</strong> <strong>State</strong> <strong>of</strong> Europe’s <strong>Common</strong> <strong><strong>Bird</strong>s</strong> <strong>2008</strong>Table 1SpeciesPopulation trends <strong>of</strong> common birds in Europe.Long-termShort-termClass.Class.Trend (%) Annual Change (%) Trend (%) Annual Change (%)Corvus corax <strong>Common</strong> Raven 118 3 58 2 othCorvus corone & cornix Carrion & Hooded Crow 22 1 9 0 — othCorvus frugilegus Rook 42 1 23 1 farmCorvus monedula Eurasian Jackdaw 22 0 — -6 -1 — othCuculus canorus <strong>Common</strong> Cuckoo -12 -1 -5 -1 othCyanopica cyanus Azure-winged Magpie 1, 4 225 11 othDelichon urbicum Northern House-martin -3 -2 -12 -2 — othDendrocopos major Great Spotted Woodpecker 46 1 16 2 othDendrocopos minor Lesser Spotted Woodpecker -75 -7 -47 -6 ? forDendrocopos syriacus Syrian Woodpecker 1, 5 26 1 ? othDryocopus martius Black Woodpecker 93 2 69 2 ? forEmberiza cia Rock Bunting 1, 4, 7 144 4 othEmberiza cirlus Cirl Bunting 1 62 4 farmEmberiza citrinella Yellowhammer -40 -2 -19 -1 farmEmberiza hortulana Ortolan Bunting 7 -79 -6 -28 1 — farmEmberiza melanocephala Black-headed Bunting 1, 6 0 0 ? farmEmberiza rustica Rustic Bunting -78 -4 -67 -7 forEmberiza schoeniclus Reed Bunting -19 -1 -6 -1 othErithacus rubecula <strong>European</strong> Robin 15 1 6 1 othFalco tinnunculus <strong>Common</strong> Kestrel -26 -1 -32 -3 farmFicedula albicollis Collared Flycatcher 2, 7 207 3 71 0 — forFicedula hypoleuca <strong>European</strong> Pied Flycatcher -22 -1 -27 -1 forFringilla coelebs Eurasian Chaffinch 4 0 -6 0 — othFringilla montifringilla Brambling -67 -3 -27 -2 othGalerida cristata Crested Lark 2, 7 -98 -16 -88 -9 farmGalerida theklae <strong>The</strong>kla Lark 1, 4 11 1 — farmGallinago gallinago <strong>Common</strong> Snipe -36 -2 -16 0 — othGarrulus glandarius Eurasian Jay 37 0 — 49 2 forHippolais icterina Icterine Warbler -37 -2 -5 -1 othHippolais polyglotta Melodious Warbler 1 -2 -1 — othHirundo rupestris Eurasian Crag-martin 1, 4 105 4 ? othHirundo rustica Barn Swallow -7 0 — -9 -1 farmJynx torquilla Eurasian Wryneck 7 -63 -4 -44 -4 othLanius collurio Red-backed Shrike -27 0 — 37 1 — farmLanius minor Lesser Grey Shrike 1, 5 2 0 ? farmLanius senator Woodchat Shrike 1, 4, 7 -46 -3 farmClass. – Trend classification: moderate increase, — stable, moderate decline, steep decline, ? uncertain. Habitat: farm – farmland, for – forest, oth – other.1 long-term trend not available, 2 long-term trend: 1982–2006, 3 short-term trend: 1991–2006, 4 short-term trend: 1996–2006, 5 short-term trend: 1999–2006,6 short-term trend: 2004–2006, 7 index in early years might be less reliable, 8 index might be influenced by releases by hunters. See page 17 for a full description <strong>of</strong> theclassifications.Habitat14
<strong>The</strong> <strong>State</strong> <strong>of</strong> Europe’s <strong>Common</strong> <strong><strong>Bird</strong>s</strong> <strong>2008</strong>Table 1Population trends <strong>of</strong> common birds in Europe.SpeciesLong-termShort-termClass.Trend (%) Annual Change (%) Trend (%) Annual Change (%)Class. HabitatLimosa limosa Black-tailed Godwit 1 -40 -3 farmLocustella fluviatilis Eurasian River Warbler 2, 7 -56 -1 — -23 -1 — othLocustella naevia<strong>Common</strong>Grasshopper-warbler-39 -1 — -23 -2 othLullula arborea Wood Lark 7 -47 -2 ? 14 0 — othLuscinia luscinia Thrush Nightingale 14 1 19 1 othLuscinia megarhynchos <strong>Common</strong> Nightingale -63 -4 6 0 — othMelanocoryphacalandraCalandra Lark 1, 4 22 1 — farmMerops apiaster <strong>European</strong> Bee-eater 1 -1 2 ? othMiliaria calandra Corn Bunting -64 -3 -14 -1 — farmMotacilla alba White Wagtail -16 0 -28 -1 othMotacilla cinerea Grey Wagtail 7 386 0 — -31 -1 othMotacilla flava Yellow Wagtail -61 -3 -24 -1 — farmMuscicapa striata Spotted Flycatcher -50 -3 -28 -2 — othNucifraga caryocatactes Spotted Nutcracker 50 -1 — -45 -4 forOenanthe hispanica Black-eared Wheatear 1, 4 -41 -3 farmOenanthe oenanthe Northern Wheatear 7 -52 -4 -51 -4 othOriolus oriolus Eurasian Golden Oriole 2 44 2 35 1 — othParus ater Coal Tit -5 0 — -15 -1 forParus caeruleus Blue Tit 37 1 27 2 othParus cristatus Crested Tit -33 -1 -5 0 — forParus major Great Tit 11 0 — 16 1 othParus montanus Willow Tit -56 -4 -34 -2 — forParus palustris Marsh Tit -36 -2 -16 -1 — forPasser domesticus House Sparrow -58 -3 -5 -1 othPasser montanus Eurasian Tree Sparrow -52 -2 7 -1 — farmPerdix perdix Grey Partridge -79 -7 -56 -7 farmPetronia petronia Rock Sparrow 1, 4, 7 76 3 farmPhoenicurus ochruros Black Redstart 2, 7 28 0 — -3 0 — othPhoenicurusphoenicurus<strong>Common</strong> Redstart 9 1 38 1 forPhylloscopus bonelli Bonelli’s Warbler 1 -35 -2 ? forPhylloscopus collybita <strong>Common</strong> Chiffchaff 34 2 -32 -1 forPhylloscopus sibilatrix Wood Warbler -27 -2 -28 -4 forPhylloscopus trochilus Willow Warbler -26 -2 -26 -2 othClass. – Trend classification: moderate increase, — stable, moderate decline, steep decline, ? uncertain. Habitat: farm – farmland, for – forest, oth – other.1 long-term trend not available, 2 long-term trend: 1982–2006, 3 short-term trend: 1991–2006, 4 short-term trend: 1996–2006, 5 short-term trend: 1999–2006,6 short-term trend: 2004–2006, 7 index in early years might be less reliable, 8 index might be influenced by releases by hunters. See page 17 for a full description <strong>of</strong> theclassifications.15
<strong>The</strong> <strong>State</strong> <strong>of</strong> Europe’s <strong>Common</strong> <strong><strong>Bird</strong>s</strong> <strong>2008</strong>Table 1Population trends <strong>of</strong> common birds in Europe.SpeciesLong-termShort-termClass.Trend (%) Annual Change (%) Trend (%) Annual Change (%)Class. HabitatPica pica Black-billed Magpie 2 -1 -30 -3 othPicus canus Grey-faced Woodpecker 2, 7 53 1 ? -15 -2 — forPicus viridisEurasian GreenWoodpecker55 2 61 3 othPrunella modularis Hedge Accentor -30 -1 -10 -1 othPyrrhocorax pyrrhocorax Red-billed Chough 1, 4 63 5 ? othPyrrhula pyrrhula Eurasian Bullfinch -50 -1 -33 -2 forRegulus ignicapilla Firecrest 2, 7 -32 0 — -43 0 — forRegulus regulus Goldcrest -41 -1 -56 -2 forSaxicola rubetra Whinchat -55 -2 0 0 — farmSaxicola torquatus <strong>Common</strong> Stonechat 2, 7 -45 -1 ? -32 -1 — farmSerinus serinus <strong>European</strong> Serin 2, 7 -48 -4 -40 -3 farmSitta europaea Wood Nuthatch 71 1 -10 -1 — forStreptopelia decaocto Eurasian Collared-dove 99 3 116 5 othStreptopelia turtur <strong>European</strong> Turtle-dove -66 -4 -23 -1 farmSturnus unicolor Spotless Starling 1, 4 67 4 farmSturnus vulgaris <strong>Common</strong> Starling -52 -2 -6 -1 — farmSylvia atricapilla Blackcap 89 3 28 2 othSylvia borin Garden Warbler -17 -1 -13 0 — othSylvia cantillans Subalpine Warbler 1 -5 1 ? othSylvia communis <strong>Common</strong> Whitethroat 23 1 8 1 farmSylvia curruca Lesser Whitethroat -14 0 — 9 1 othSylvia melanocephala Sardinian Warbler 1 -18 2 — othSylvia nisoria Barred Warbler 2, 7 40 0 ? -21 -2 ? othSylvia undata Dartford Warbler 1, 4 -43 -5 othTringa totanus <strong>Common</strong> Redshank -34 -3 -8 -1 — othTroglodytes troglodytes Winter Wren 44 2 0 1 othTurdus iliacus Redwing -1 0 — 7 0 othTurdus merula Eurasian Blackbird 11 1 13 1 othTurdus philomelos Song Thrush -10 0 13 1 othTurdus pilaris Fieldfare -3 1 -43 -1 othTurdus viscivorus Mistle Thrush -30 -1 -15 -1 — forUpupa epops Eurasian Hoopoe 2, 7 251 5 ? -20 -1 ? farmVanellus vanellus Northern Lapwing -45 -3 -27 -2 farmClass. – Trend classification: moderate increase, — stable, moderate decline, steep decline, ? uncertain. Habitat: farm – farmland, for – forest, oth – other.1 long-term trend not available, 2 long-term trend: 1982–2006, 3 short-term trend: 1991–2006, 4 short-term trend: 1996–2006, 5 short-term trend: 1999–2006,6 short-term trend: 2004–2006, 7 index in early years might be less reliable, 8 index might be influenced by releases by hunters. See page 17 for a full description <strong>of</strong> theclassifications.16
<strong>The</strong> <strong>State</strong> <strong>of</strong> Europe’s <strong>Common</strong> <strong><strong>Bird</strong>s</strong> <strong>2008</strong>Lesser Whitethroat Sylvia currucahas been stable across Europe,possibly due to the south-easterlydirection <strong>of</strong> its migration,which makes it unaffectedby the Sahel drought.Photo by D. Jirovský (wildbirdphoto.eu)BOX 1: Trend classification<strong>The</strong> multiplicative overall slope estimate(trend value) in TRIM is converted intoone <strong>of</strong> the following categories.<strong>The</strong> category depends on the overallslope, as well as its 95% confidenceinterval (= slope +/- 1.96 times thestandard error <strong>of</strong> the slope).• Strong increase – increase significantly morethan 5% per year (5% would mean a doublingin abundance within 15 years). Criterion: lowerlimit <strong>of</strong> confidence interval > 1.05.• Moderate increase – significant increase, butnot significantly more than 5% per year.Criterion: 1.00 < lower limit <strong>of</strong> confidenceinterval < 1.05.• Stable – no significant increase or decline, and itis certain that trends are less than 5% per year.Criterion: confidence interval encloses 1.00 butlower limit > 0.95 and upper limit < 1.05.• Uncertain – no significant increase or decline,but not certain if trends are less than 5% peryear. Criterion: confidence interval encloses 1.00but lower limit < 0.95 or upper limit > 1.05.• Moderate decline – significant decline, but notsignificantly more than 5% per year. Criterion:0.95 < upper limit <strong>of</strong> confidence interval < 1.00.• Steep decline - decline significantly more than5% per year (5% would mean a halving inabundance within 15 years). Criterion: upperlimit <strong>of</strong> confidence interval < 0.95.17
<strong>The</strong> <strong>State</strong> <strong>of</strong> Europe’s <strong>Common</strong> <strong><strong>Bird</strong>s</strong> <strong>2008</strong>Photo by T. Pospíšil (birdphoto.cz)Figure 12 | Regional trends <strong>of</strong> the Mallard Anasplatyrhynchos in Europe. Countries contributingtheir data are grouped as follows: North Europe:Norway; West Europe: Belgium, Denmark, formerWest Germany, Netherlands; South Europe: France;Central and East Europe: Czech Republic, Estonia,former East Germany, Hungary, Poland.[<strong>The</strong> sudden decline <strong>of</strong> the index in South <strong>European</strong>region at the beginning <strong>of</strong> the time period most likelyreflects insufficient data rather than real decline.]<strong>The</strong> long-term trend <strong>of</strong> the Mallard Anasplatyrhynchos has shown a moderate increase,but since 1985 the species has remained stable.<strong>The</strong> increase is more prominent in western andnorthern Europe, while the southern and eastern<strong>European</strong> population appears to be stable(see Figure 12). <strong>The</strong> increase <strong>of</strong> the <strong>European</strong>population may be caused partially by releases <strong>of</strong>hand-reared birds for hunting. <strong>The</strong> common andwidespread nature <strong>of</strong> this species means that it isone <strong>of</strong> the few waterfowl whose abundance canbe assessed using common breeding birdmonitoring scheme methods. <strong>The</strong> informationthat this provides about the breeding populationcan be compared to other programmes, such asthe International Waterbird <strong>Census</strong>, whichmonitors the wintering population.18
<strong>The</strong> <strong>State</strong> <strong>of</strong> Europe’s <strong>Common</strong> <strong><strong>Bird</strong>s</strong> <strong>2008</strong>Use <strong>of</strong> common birdmonitoring data forpolicy and science<strong>The</strong> interaction and cooperation betweenscientists and policy makers has been a criticalfeature in the successful development andadoption <strong>of</strong> the wild bird indicators in Europe.This interaction has helped the PECBMS todevelop summary statistics and information thatspecifically target and understand the policyneeds. Thanks to this, the wild bird indicatorshave been promoted for <strong>of</strong>ficial use in a number<strong>of</strong> different reporting processes in Europe.<strong>The</strong> Farmland <strong>Bird</strong> Index (FBI) has beenadopted by the EU as an Indicator <strong>of</strong> SustainableDevelopment and a Structural Indicator (http://ec.europa.eu/eurostat). Furthermore, the FBI,produced in accordance with the methodologydeveloped by the PECBMS, has been adopted asan indicator for the EU Rural DevelopmentPlans under the Council Regulation (EC) No.1698/2005 (http://ec.europa.eu/agriculture/rurdev/eval/index_en.htm). Indicators underthe framework <strong>of</strong> the Structural and SustainableDevelopment Indicators are routinely producedby the PECBMS at a national level using a single<strong>European</strong> species’ habitat classification, butnational versions <strong>of</strong> the indicators that use theirown species’ classifications are in common usefor good reasons. <strong>The</strong> <strong>European</strong>-scale speciesclassifications allow meaningful comparisons <strong>of</strong>indicators across countries, so-called‘benchmarking’, while national-scale species’classifications may be able to capture importantelements <strong>of</strong> the local environment withinnational wild bird indicators. National versions<strong>of</strong> the FBI used in Rural Development Plans, forexample, can use country-specific species’habitat classifications, and due to this the<strong>The</strong> Redshank Tringa totanus hasshown a moderate decline since 1980.<strong>The</strong> loss and fragmentation <strong>of</strong> itshabitat due to agriculture practices isbelieved to be a key factor in itsdecline. This wet grassland speciestend to nest in small patches <strong>of</strong>relatively tall vegetation which arelikely to be uncommon on the shortand uniform sward that ischaracteristic <strong>of</strong> heavily grazedsaltmarshes (Norris et al. 1998).Habitat fragmentation concentratesbreeding birds into smaller areas,where they are less effective at drivingaway predators. This effect may becompounded by a parallel increase inthe populations <strong>of</strong> crows and foxes. Itis therefore likely that these factors areaffecting the breeding productivity <strong>of</strong>Redshank as well as other waders(Stanbury et al. 2000). However, theprecise numbers <strong>of</strong> breeding birds arerather difficult to obtain due to the lowterritoriality <strong>of</strong> the species.Photo by P. Šaj (birdphoto.cz)19
<strong>The</strong> <strong>State</strong> <strong>of</strong> Europe’s <strong>Common</strong> <strong><strong>Bird</strong>s</strong> <strong>2008</strong>Populations <strong>of</strong> Eurasian LinnetCarduelis cannabina declinedmoderately in the 1980s and thenagain after 1990. This farmland speciessuffers from changes in farmingpractices leading to shortage <strong>of</strong>seed supply in winter and destruction<strong>of</strong> nesting habitat like hedges andsmall tree patches in farmland.Photo by Z. Tunka (birdphoto.cz)indicators may well differ slightly. In presentingdifferent indicators, it is important to explainspecies selection and define the purpose <strong>of</strong> eachindicator.<strong>The</strong> SEBI 2010 (Streamlining <strong>European</strong> 2010Biodiversity Indicators) project, a pan-<strong>European</strong>initiative led by the <strong>European</strong> EnvironmentAgency (EEA), incorporated the wild birdindicator in the set <strong>of</strong> indicators to assessprogress towards the <strong>European</strong> target <strong>of</strong> haltingbiodiversity loss by 2010 (Gregory et al. <strong>2008</strong>).Other international initiatives and organisationsuse the wild bird indicators and underlying dataproduced by the PECBMS too. Examples includethe OECD, the Core Set <strong>of</strong> Indicators <strong>of</strong> theEEA, the Living Planet Index (http://assets.panda.org/downloads/living_planet_report_<strong>2008</strong>.pdf) and several others. <strong>The</strong> <strong>European</strong>approach developed and promoted by thePECBMS is also beginning to inspire othersimilar initiatives in other continents; recently,for example, in the USA where the first wild birdindicators have been published in spring 2009(http://www.state<strong>of</strong>thebirds.org/pdf_files/<strong>State</strong>_<strong>of</strong>_the_<strong><strong>Bird</strong>s</strong>_2009.pdf). <strong>The</strong> <strong>European</strong> wild birdindicators also paved the way for thedevelopment <strong>of</strong> the so called ‘Global World <strong>Bird</strong>Index Project’, an RSPB and <strong>Bird</strong>LifeInternational initiative, seeking to motivate,encourage and support bird populationmonitoring around the globe through the 2010Biodiversity Indicators Partnership Project(http://www.twentyten.net).Wild bird indicators have been adopted atnational level in at least 15 <strong>European</strong> countriestoo. In Sweden, for example, the government hasadopted 16 environmental objectives, four <strong>of</strong>which are underpinned by common bird indices(http://miljomal.nu). France is using anindicator system where species are grouped byhabitat and specialisation (http://www.mnhn.fr/vigie-nature/STOC_indicateurs.htm). In theNetherlands, a number <strong>of</strong> indicators for manykinds <strong>of</strong> habitats and species groups have beendeveloped and the government reports on themannually, although, as yet, they do not haveformal status (www.natuurcompendium.nl).In the UK, the common bird indicator is a part<strong>of</strong> an <strong>of</strong>ficial set <strong>of</strong> high pr<strong>of</strong>ile, ‘Framework’indicators and the UK government and itsagencies have pledged to reverse the decline <strong>of</strong>farmland and woodland birds by 2020. Similarframeworks are being developed in other<strong>European</strong> countries, too (Gregory et al. <strong>2008</strong>).20
<strong>The</strong> <strong>State</strong> <strong>of</strong> Europe’s <strong>Common</strong> <strong><strong>Bird</strong>s</strong> <strong>2008</strong>Furthermore, the development and use <strong>of</strong> wildbird indicators in Europe has triggered moreintensive research into the potential drivingforces behind population trends <strong>of</strong> species anddevelopment <strong>of</strong> species action plans, asillustrated by examples from the UK and theNetherlands. While most <strong>of</strong> these examplespoint to successful progress and the intelligentuse <strong>of</strong> wild bird indicators to promote informedconservation and land management policies,there is a need for stronger support andleadership from the EU and nationalgovernments in securing the underlying dataand in indicator production and use. Suchassistance would allow targets for biodiversityconservation to be more tightly defined; suchtargets could then be regularly reviewed, andintegrated recovery plans could be developed.Monitoring data can be also used in research.It is desirable to use monitoring data to develophypotheses on trends using explorative analysis,or to test hypotheses on large-scale drivers <strong>of</strong>population changes. Publications in scientificpapers also help to disseminate information onspecies’ trends and methodology. This bringstransparency and credibility to the projectproducts. Numerous examples <strong>of</strong> scientific papersusing monitoring data at national level can befound in the literature, and some papers clearlylinked to PECBMS <strong>European</strong> outputs can beidentified too. <strong>The</strong> publication <strong>of</strong> scientific paperslinked to PECBMS started well before the <strong>of</strong>ficialstart <strong>of</strong> the scheme in 2002. For example, theresults <strong>of</strong> a pilot study paved the methodologicalroad to routine production <strong>of</strong> <strong>European</strong> speciestrends and indices (Van Strien et al. 2001). Thisinnovative paper describes clearly a method hownational species indices can be combined intomulti-national ones. <strong>The</strong> national species indicesshould be ideally calculated using log-linearregression, which allows for plot turnover. Suchcalculations were made easy by the s<strong>of</strong>tware toolTRIM (www.ebcc.info; Pannekoek and VanStrien 2001). A further conceptual paper waspublished in 2005 (Gregory et al. 2005), whichpresented the approach <strong>of</strong> PECBMS indeveloping biodiversity indicators using datafrom common bird monitoring schemes.This described a methodology by which dataPhoto by T. Bělka (birdphoto.cz)<strong>The</strong> Black RedstartPhoenicurus ochruros populationremains stable in both longandshort-term across Europe.Its exploitation <strong>of</strong> nesting sitesin urban areas since the 19th centuryseems to be successful and this recentlycolonised habitat still provides suitableconditions for breeding.21
<strong>The</strong> <strong>State</strong> <strong>of</strong> Europe’s <strong>Common</strong> <strong><strong>Bird</strong>s</strong> <strong>2008</strong>Photo by D. Jirovský (wildbirdphoto.eu)Both papers represented a milestonein reference to PECBMS, mostly asa source <strong>of</strong> information about themethods used to calculate speciesindices and indicators.Another paper, published quiterecently (Gregory et al. <strong>2008</strong>), usesexamples from the UK and Europe toillustrate the state <strong>of</strong> play regardingthe use <strong>of</strong> birds as indicators. <strong>The</strong> UKexperience provides an excellentexample <strong>of</strong> turning scientific data intopolicy measures in natureconservation, which has subsequentlybeen followed by other countries. Alsoat <strong>European</strong> level, the common birdindicators proved to be successful interms <strong>of</strong> use in policy and in fact theyrepresent one <strong>of</strong> very few fullyoperational biodiversity indicators inEurope.<strong>The</strong> Great Reed-warbler Acrocephalusarundinaceus is expected to benefit from climatechange (Gregory et al. 2009). In Poland, it hasalready been shown to be adapting well by shiftingits laying dates, probably to optimise foodresources (Dyrcz and Halupka 2009).from national or regional breeding birdmonitoring schemes can be analysed,supranational species indices can be generatedand multi-species indicators can be calculated byaveraging the resulting indices. <strong>The</strong> paper showedhow data collated by skilled volunteers and bymethods and survey designs that differ slightlybetween countries can be combined to producerelevant multi-national results. It also describedhow and why national species indices need to beweighted by population size in order to producerelevant supra-national figures. <strong>The</strong> paper alsoshowed that common farmland birds in Europehave declined steeply since 1980, and thatevidence elsewhere shows that the main driver <strong>of</strong>farmland bird declines is agriculturalintensification.<strong>The</strong> PECBMS <strong>European</strong> data werealso used for explorative analysis <strong>of</strong>species trends, particularly <strong>of</strong> forestspecies (Gregory et al. 2007). This showed thatsince 1980, forest specialists have declinedmore than forest generalists, but trendsdiffered regionally, and interestingly forestspecies in Central and Eastern Europe haveshown stability or even increased. Anindependent study demonstrated that forestspecialists have increased in the CzechRepublic, most likely as a result <strong>of</strong> increasingforest coverage and age (Reif et al. 2007). At<strong>European</strong> level, among common forest birds,long-distance migrants and residents onaverage declined most strongly, whereas shortdistancemigrants were largely stable, or evenincreased. <strong>The</strong>re was some evidence to suggestthat ground- or low-nesting species declinedmore strongly on average, as did forest birdswith invertebrate diets. It also appeared thatin a small number <strong>of</strong> species, year-to-yearvariation in abundance can be influenced bycold winters. However, much more researchneeds to be done to understand trends <strong>of</strong>forest bird species and their driving forces.22
<strong>The</strong> <strong>State</strong> <strong>of</strong> Europe’s <strong>Common</strong> <strong><strong>Bird</strong>s</strong> <strong>2008</strong>Another topic <strong>of</strong> PECBMS research is rapidclimatic change, which poses a threat to globalbiodiversity. Evidence is accumulating thatclimatic change in recent decades has alteredmany biological phenomena across the globe,including the geographical ranges andabundance <strong>of</strong> plants and animals, and thethe second step was to construct a climaticimpact indicator based upon the divergence inpopulation trends between species expected tobe positively and negatively affected by climaticchange. This work detected a significantpositive relationship between interspecificvariation in population trend and the change inFigure 13 | Weighted population trend <strong>of</strong> speciespredicted to gain range in response to climatic change(30 species).Figure 14 | Weighted population trend <strong>of</strong> speciespredicted to lose range in response to climatic change(92 species).timing <strong>of</strong> events in their lives such as growth,reproduction and migration. Scientists andpolicy makers are calling for the development<strong>of</strong> indicators <strong>of</strong> the impacts <strong>of</strong> climatic changeon biodiversity based upon these phenomenathat summarise impacts over many species andlarge areas. <strong>The</strong> purpose <strong>of</strong> such indicators is tosummarise sets <strong>of</strong> related impacts, to describehow they are changing in an accessible way, toraise awareness <strong>of</strong> the biological consequences<strong>of</strong> climatic warming, and to assist both insetting targets for the reduction <strong>of</strong> impacts andin guiding the implementation <strong>of</strong> mitigationand adaptation measures. PECBMS has madepractical progress by working with academicsand other experts to develop a biologicalindicator <strong>of</strong> climatic change impacts in twosteps. <strong>The</strong> first step was testing the performance<strong>of</strong> projections <strong>of</strong> change in the extent <strong>of</strong> species’geographical range (based upon climaticenvelope models) as predictors <strong>of</strong> observedinterspecific variation in long-term change inpopulation size <strong>of</strong> land bird species over a largepart <strong>of</strong> Europe derived from the PECBMS.Having found a robust relationship <strong>of</strong> this kind,potential range extent between the late 20thand late 21st centuries, as forecast by climaticenvelope models. <strong>The</strong> derived indicatormeasures divergence in population trendbetween bird species predicted by climaticenvelope models to be favourably affected byclimatic change and those adversely affected.<strong>The</strong> ‘Climatic Impact Indicator’ has increasedstrongly in the past twenty years, coincidingwith a period <strong>of</strong> rapid climatic warming inEurope. <strong>The</strong> key messages to emerge from thestudy are that climate change is having adetectable effect on bird populations at a<strong>European</strong> scale, including evidence <strong>of</strong> negativeas well as positive effects on their populations.<strong>The</strong> number <strong>of</strong> bird species whose populationsare observed to be negatively impacted byclimatic change is three times larger than thoseobserved to be positively affected by climatewarming in this set <strong>of</strong> <strong>European</strong> land birds (seeFigures 13 and 14). <strong>The</strong> potential links betweenchanges in bird populations and ecosystemfunctioning are not well understood. It issuggested that increasing climatic effects mightalter ecosystem functioning and resilience.23
<strong>The</strong> <strong>State</strong> <strong>of</strong> Europe’s <strong>Common</strong> <strong><strong>Bird</strong>s</strong> <strong>2008</strong>ReferencesAebischer, N. J. and Kavanagh, B. (1997). Grey Partridge (Perdixperdix). In: Hagemeijer, E. J. M. and Blair, M. J. (Eds) <strong>The</strong> EBCC Atlas<strong>of</strong> <strong>European</strong> Breeding <strong><strong>Bird</strong>s</strong>: <strong>The</strong>ir Distribution and Abundance. Tand D Poyser, London.Aebischer, N. J., Evans, A. D., Grice, P. V. and Vickery,J. A. (Eds.) (2000). Ecology and conservation <strong>of</strong> lowland farmlandbirds. Tring, UK. British Ornithologists Union.Baines, D. (1990). <strong>The</strong> Roles <strong>of</strong> Predation, Food and AgriculturalPractice in Determining the Breeding Success<strong>of</strong> the Lapwing (Vanellus vanellus) on Upland Grasslands.Journal <strong>of</strong> Animal Ecology 59: 915–929.Bednorz, J. (1997). Raven Corvus corax. In: Hagemeijer,E. J. M. and Blair, M. J. (Eds) <strong>The</strong> EBCC Atlas <strong>of</strong> <strong>European</strong> Breeding<strong><strong>Bird</strong>s</strong>: <strong>The</strong>ir Distribution and Abundance. T and D Poyser, London.Borg, C. and T<strong>of</strong>t, S. (2000). Importance <strong>of</strong> Insect Prey Quality for GreyPartridge Chicks Perdix perdix: A Self-Selection Experiment. Journal <strong>of</strong>Applied Ecology 37: 557–563.Bro, E., Sarrazin, F., Clobert, J. and Reitz, F. (2000). Demographyand the Decline <strong>of</strong> the Grey Partridge Perdix perdix in France.Journal <strong>of</strong> Applied Ecology 37: 432–448.Bro, E., Reitz, F., Clobert, J., Migot, P. and Massot, M. (<strong>2008</strong>).Diagnosing the environmental causes <strong>of</strong> the decline in Grey PartridgePerdix perdix survival in France. Ibis 143: 120–132.Donald, P. F., Green, R. E. and Heath, M. F. (2001). Agriculturalintensification and the collapse <strong>of</strong> Europe’s farmland bird populations.Proc. R. Soc. Lond. B 268: 25–29.Donald, P. F., Sanderson, F. J., Burfield, I. J., Bierman, S. M., Gregory,R. D. and Waliczky, Z. (2007). International Conservation PolicyDelivers Benefits for <strong><strong>Bird</strong>s</strong> in Europe. Science 317: 810–813.Dyrcz, A. and Halupka, L. (2009). <strong>The</strong> response <strong>of</strong> the Great ReedWarbler Acrocephalus arundinaceus to climate change. Journal <strong>of</strong>Ornithology 150: 0021–837.Glutz, M. and Jensen, F. P. (2007). Management plan for Turtle Dove(Streptopelia turtur) 2007–2009. Luxembourg: Office for OfficialPublications <strong>of</strong> the <strong>European</strong> Communities, 2007.Gregory, R. D., Van Strien, A. J., Vorisek, P., Gmelig Meyling, A. W.,Noble, D. G., Foppen, R. P. B. and Gibbons, D. W. (2005). Developingindicators for <strong>European</strong> birds. Phil. Trans. R. Soc. Lond. B. 360: 269–288.Gregory, R. D., Vorisek, P., Van Strien, A., Gmelig Meyling,A. W., Jiguet, F., Fornasari, L., Reif, J., Chylarecki, P. and Burfield, I.(2007). Population trends <strong>of</strong> widespread woodland birds in Europe.Ibis 149 (Suppl. 2): 78–97.Gregory, R. D., Voříšek, P., Noble, D. G., Van Strien, A., Klvaňová, A.,Eaton, M., Gmelig Meyling, A. W., Joys, A., Foppen, R. P. B. andBurfield, I. J. (<strong>2008</strong>). <strong>The</strong> generation and use <strong>of</strong> bird populationindicators in Europe. <strong>Bird</strong> Conservation International 18: S223–S244.<strong>Bird</strong>Life International <strong>2008</strong>.Gregory, R. D., Willis, S. G., Jiguet, F., Voříšek, P., Klvaňová, A.,van Strien, A., Huntley, B., Collingham, Y. C., Couvet, D. and Green,R. E. (2009). An indicator <strong>of</strong> the impact <strong>of</strong> climatic change on<strong>European</strong> bird populations. PLoS ONE 4(3): e4678. doi:10.1371/journal.pone.0004678.Henle, K., Alard, D., Clitherow, J., Cobb, P., Firbank, L., Kull, T.,McCracken, D., Moritz, R. F. A., Niemelä, J., Rebane, M., Wascher, D.,Watt, A. and Young, J. (<strong>2008</strong>). Identifying and managing the conflictsbetween agriculture and biodiversity conservation in Europe –a review. Agriculture, Ecosystems & Environment 124 (1–2): 60–71.Jarry, G. (1992). Biologie de la Tourterelle des bois (Streptopelia turtur)au Sénégal – Région de M’Bour. CRBPO Report, Paris.Marchant, J. H., Hudson, R., Carter, S. P. and Whittington, P. (1990).Population Trends in British Breeding <strong><strong>Bird</strong>s</strong>. NCC/BTO, Tring.Newton, I. (2004). <strong>The</strong> recent declines <strong>of</strong> farmland bird populations inBritain: an appraisal <strong>of</strong> causal factors and conservation actions. Ibis 146(4): 579–600.Nipkow, M. (1997). Stone Curlew (Burhinus oedicnemus).In: Hagemeijer, E. J. M. and Blair, M. J. (Eds) <strong>The</strong> EBCC Atlas<strong>of</strong> <strong>European</strong> Breeding <strong><strong>Bird</strong>s</strong>: <strong>The</strong>ir Distribution and Abundance.T and D Poyser, London.Norris, K., Brindley, E., Cook, T., Babbs, S., Forster Brown, C. andYaxley, R. (1998). Is the density <strong>of</strong> redshank Tringa totanus nesting onsaltmarshes in Great Britain declining due to changes in grazingmanagement? Journal <strong>of</strong> Applied Ecology 35: 621–634.Pakkala, T., Šálek, M. and Tiainen, J. (1997). <strong>The</strong> Lapwing (Vanellusvanellus). In: Hagemeijer, E. J. M. and Blair, M. J. (Eds) <strong>The</strong> EBCC Atlas<strong>of</strong> <strong>European</strong> Breeding <strong><strong>Bird</strong>s</strong>: <strong>The</strong>ir Distribution and Abundance. T andD Poyser, London.Pannekoek, J. and Van Strien, A. J. (2001). TRIM 3 Manual. TRendsand Indices for Monitoring Data. Research paper No. 0102. StatisticsNetherlands, Voorburg, <strong>The</strong> Netherlands.PECBMS (2007). <strong>The</strong> <strong>State</strong> <strong>of</strong> Europe’s <strong>Common</strong> <strong><strong>Bird</strong>s</strong>, 2007. CSO/RSPB, Prague, Czech Republic.Rands, M. R. W. (1985). Pesticide Use on Cereals and the Survival <strong>of</strong>Grey Partridge Chicks: A Field Experiment. Journal <strong>of</strong> Applied Ecology22: 49–54.Reif, J., Voříšek, P., Šťastný, K., Bejček, V. and Petr, J. (2007). Populationincrease <strong>of</strong> forest birds in the Czech Republic between 1982 and 2003.<strong>Bird</strong> Study 54: 248–255.Reif, J., Voříšek, P., Šťastný, K., Bejček, V. and Petr, J. (<strong>2008</strong>).Agricultural intensification and farmland birds: new insights froma central <strong>European</strong> country. Ibis 150: 596–605.Schulze-Hagen, K. (1997). Great Reed Warbler (Acrocephalusarundinaceus). In: Hagemeijer, E. J. M. and Blair, M. J. (Eds) <strong>The</strong> EBCCAtlas <strong>of</strong> <strong>European</strong> Breeding <strong><strong>Bird</strong>s</strong>: <strong>The</strong>ir Distribution and Abundance.T and D Poyser, London.Sirami, C., Brotons, L., Burfield, I., Fonderflick, J. and Martin J.-L.(<strong>2008</strong>). Is land abandonment having an impact on biodiversity?A meta-analytical approach to bird distribution changes in the northwesternMediterranean. Biological Conservation 141: 450–459.Stanbury, A., O’Brien, M. and Donaghy, A. (2000). Trends in BreedingWader Populations in key areas within Northern Ireland between 1986and 2000. Irish <strong><strong>Bird</strong>s</strong> 6:513–526.Tapper, S. C., Potts, G. R. and Brockless, M. H. (1996). <strong>The</strong> Effect<strong>of</strong> an Experimental Reduction in Predation Pressure on the BreedingSuccess and Population Density <strong>of</strong> Grey Partridges Perdix perdix.Journal <strong>of</strong> Applied Ecology 33: 965–978.Taylor, I. R. and Grant, M. C. (2004). Long-term trends in theabundance <strong>of</strong> breeding Lapwing Vanellus vanellus in relation to landusechange on upland farmland in southern Scotland. <strong>Bird</strong> Study 51:133–142.Van Strien, A. J., Pannekoek, J. and Gibbons, D.W. (2001). Indexing<strong>European</strong> bird population trends using results <strong>of</strong> national monitoringschemes: a trial <strong>of</strong> a new method. <strong>Bird</strong> Study 48: 200–213.Wretenberg, J., Lindström, Å., Svensson, S., Thierfelder, T. and Pärt, T.(2006). Population trends <strong>of</strong> farmland birds in Sweden and England:similar trends but different patterns <strong>of</strong> agricultural intensification.Journal <strong>of</strong> Applied Ecology 43: 1110–1120.24
<strong>The</strong> <strong>State</strong> <strong>of</strong> Europe’s <strong>Common</strong> <strong><strong>Bird</strong>s</strong> <strong>2008</strong>Both long- and short-term trends<strong>of</strong> the Long-tailed Tit Aegithalos caudatus,a widespread resident species in most<strong>of</strong> Europe, remained stable.Photo by D. Jirovský (wildbirdphoto.eu)Important references and web sites on national monitoring schemesAustriaTeufelbauer, N. (2009). Monitoring der BrutvögelÖsterreichs. Bericht über die Saisonen 2007 und <strong>2008</strong>.<strong>Bird</strong>Life Österreich, Wien. 11pp.w http://www.birdlife.at/Lebensraumschutz.htm#BVMBelgium – BrusselsWeiserbs, A. and Jacob, J. P. (2007). Survey <strong>of</strong> commonbreeding birds in the Brussels Region: Analyze <strong>of</strong> theresults 1992–2005. Aves 44: 65–78.Czech RepublicReif, J., Voříšek, P., Šťastný, K. and Bejček, V. (2006).Population trends <strong>of</strong> birds in the Czech Republicduring 1982–2005. Sylvia 42: 22–37 (in Czech withEnglish summary).w www.birdlife.cz, http://jpsp.birds.cz (both in Czech)DenmarkHeldbjerg, H. and A. Eskildsen (<strong>2008</strong>): MonitoringPopulation Changes <strong>of</strong> <strong>Common</strong> <strong><strong>Bird</strong>s</strong> in Denmark1975-<strong>2008</strong>. Dansk Ornitologisk Forening (in Danishwith English summary). w www.d<strong>of</strong>.dk/punktEstoniaLeito, A. and Kuresoo, A. (2004). Preliminary results <strong>of</strong>a national bird monitoring programme in Estonia. In:Anselin, A (ed.) <strong>Bird</strong> Numbers 1995, Proceedings <strong>of</strong> theInternational Conference and 13th meeting <strong>of</strong> the EBCC,Pärnu, Estonia. <strong>Bird</strong> <strong>Census</strong> News 13 (2000): 81–86.w http://www.ebcc.info/wpimages/other/10-Leito%20&%20KuresooH.pdfFinlandVäisänen, R. A. (2006). Monitoring population changes<strong>of</strong> 86 land bird species breeding in Finland in 1983–2005.Linnut-vuosikirja (<strong>The</strong> yearbook <strong>of</strong> the Linnut magazine)2005: 83–98. w http://www.fmnh.helsinki.fi/english/zoology/vertebrates/info/birds/86landbirds.htmFranceJiguet, F. (2007). Bilan du programme STOC pour laFrance en 2007. w http://www2.mnhn.fr/vigie-nature/IMG/pdf/STOC-bilan_2007.pdf (in French)GermanyMitschke, A., Sudfeldt, C., Heidrich-Riske, H. andDröschmeister, R. (2005). Das neue Brutvogelmonitoringin der Normallandschaft Deutschlands –Untersuchungsgebiete, Erfassungsmethode und ersteErgebnisse. Vogelwelt 126: 127–140. w http://www.ddaweb.de/index.php?cat=Monitoring&id=1&subid=1&ssc=0&lang=en (in English)HungarySzép, T. and Gibbons, D. (2000). Monitoring <strong>of</strong> commonbreeding birds in Hungary using a randomised samplingdesign. <strong>The</strong> Ring 22: 45–55.w http://www.mme-monitoring.hu25
<strong>The</strong> <strong>State</strong> <strong>of</strong> Europe’s <strong>Common</strong> <strong><strong>Bird</strong>s</strong> <strong>2008</strong>IrelandCoombes, R. H., Crowe, O., Lysaght, L., O’Halloran, J.,O’Sullivan, O. and Wilson, H. J. (2006). Countryside <strong>Bird</strong>Survey Report 1998–2005. <strong>Bird</strong>Watch Ireland, Wicklow.w http://www.birdwatchireland.ieItalyFornasari, L. and de Carli, E. (2002). A new project onbreeding bird monitoring in Italy. <strong>Bird</strong> <strong>Census</strong> News15 (2): 42–54. w http://www.mito2000.itLatviaAunins, A. and Priednieks, J. (2003). <strong>Bird</strong> populationchanges in Latvian farmland 1995–2000: responses todifferent scenarios <strong>of</strong> rural development. Ornis Hungarica12–13: 41–50. w http://www.lob.lv/lv/lp_monitorings<strong>The</strong> NetherlandsDijk, A.J. van, Dijksen, L., Hustings, F., K<strong>of</strong>fijberg, K.,Schoppers, J., Teunissen, W., Turnhout, C. van, Weide, M.J. T. van der, Zoetebier, D. and Plate, C. (2005).Broedvogels in Nederland in 2003. SOVONMonitoringrapport 2005/01. SOVON VogelonderzoekNederland, Beek-Ubbergen. w http://www.sovon.nlNorwayHusby, M. (2003). Point count census using volunteers <strong>of</strong>terrestrial breeding birds in Norway, and its status after sixyears. Ornis Hungarica 12–13: 63–72.PolandChylarecki, P., Jawińska, D. and Kuczyński, L. (2006).<strong>Common</strong> Breeding <strong>Bird</strong> Monitoring in Poland: Annualreport 2003-2004. Polish Society for the Protection <strong>of</strong><strong><strong>Bird</strong>s</strong>, Warszawa. w http://www.monitoringptakow.gios.gov.plw http://www.mppl.plPortugalHilton, G., Meirinho, A. and Elias, G. (2006). <strong>Common</strong><strong>Bird</strong> Monitoring is up and running in Portugal.<strong>Bird</strong> <strong>Census</strong> News 19 (1): 9–15.w http://www.spea.pt/index.php?op=censo_avesSpainEscandell, V. (2006). Breeding <strong>Bird</strong> Survey in Spain.Report 1996-2005. SEO/<strong>Bird</strong>Life, Madrid.w http://www.seo.org/?seguimientodeavesSwedenOttvall, R., Green, M., Lindström, Å., Svensson, S., Esseen,P.-A. and Marklund, L. (<strong>2008</strong>). Distribution and habitatselection <strong>of</strong> Ortolan Bunting in Sweden. Ornis Svecica 18:3–16. (In Swedish with English summary)w http://www.biol.lu.se/zooekologi/birdmonitoringSwitzerlandKeller, V., Kéry, M., Schmid, H. and Zbinden, N. (<strong>2008</strong>).Swiss <strong>Bird</strong> Index SBI®: Update 2007. Faktenblatt.Schweizerische Vogelwarte, Sempach. 4 S.w http://www.vogelwarte.chUnited KingdomRisely, K., Noble, D.G. and Baillie, S.R. (<strong>2008</strong>). <strong>The</strong>Breeding <strong>Bird</strong> Survey 2007. BTO Research Report 508.British Trust for Ornithology, <strong>The</strong>tford.w http://www.bto.org/research/indicators/index.htm,w http://www.defra.gov.uk/environment/statistics/wildlife/kf/wdkf03.htmPhoto by P. Šaj (birdphoto.cz)<strong>The</strong> Eurasian Wryneck Jynx torquilla is decliningacross Europe. Long-term changesin temperature and rainfall are thoughtto explain this sharp population decline.Habitat destruction, modern forestry techniquesand declining ant populations most probablycontribute to this process too.26
<strong>The</strong> <strong>State</strong> <strong>of</strong> Europe’s <strong>Common</strong> <strong><strong>Bird</strong>s</strong> <strong>2008</strong>Pan-<strong>European</strong> <strong>Common</strong> <strong>Bird</strong> MonitoringScheme (PECBMS) is a joint initiative <strong>of</strong> the<strong>European</strong> <strong>Bird</strong> <strong>Census</strong> Council (EBCC) and<strong>Bird</strong>Life International. <strong>The</strong> main aim <strong>of</strong> thescheme is to use common birds as indicators <strong>of</strong>the general state <strong>of</strong> nature, using scientific data onchanges in breeding populations across Europe.<strong>The</strong> PECBMS uses data from large-scalemonitoring schemes based on volunteer fieldworkwith a standardised methodology and formaldesign. Through the generation <strong>of</strong> national andsupra-national indices for individual species, itproduces <strong>European</strong> composite indices for groups<strong>of</strong> species (indicators). <strong>The</strong> PECBMS supportsand provides assistance to national or regionalcommon bird monitoring schemes, facilitates thesharing <strong>of</strong> knowledge between monitoringschemes and strives to establish new monitoringschemes in countries and regions where suchschemes are lacking. www.ebcc.info/pecbm.htmlContact: Petr Voříšek, project coordinator,Czech Society for Ornithology, Na Bělidle 252/34,CZ-150 00, Praha 5 -Smíchov, Czech Republic.E-mail: EuroMonitoring@birdlife.cz<strong>The</strong> trend <strong>of</strong> the Azure-winged MagpieCyanopica cyanus cooki was based on the datafrom both Portugal and Spain, the only two<strong>European</strong> countries populated by thissubspecies, endemic to Iberia.Photo by T. Kolaas (naturspesialisten.no)<strong>European</strong> <strong>Bird</strong> <strong>Census</strong> Council (EBCC)brings togetherornithologists from all<strong>European</strong> countriesrepresenting nationalbodies responsible for monitoring birdpopulations, distribution and demography, toencourage bird-monitoring work aimed at betterconservation and management <strong>of</strong> birdpopulations and at providing indicators <strong>of</strong> thechanging ability <strong>of</strong> <strong>European</strong> landscapes tosupport wildlife generally. www.ebcc.info<strong>Bird</strong>Life Internationalis a worldwide partnership <strong>of</strong>conservation organisations,represented in more than 100countries (including more than40 in Europe) and with morethan 2.5 million members worldwide. <strong>Bird</strong>Lifeworks for the diversity <strong>of</strong> all life and thesustainable use <strong>of</strong> natural resources through theconservation <strong>of</strong> birds and their habitats.www.birdlife.org<strong>The</strong> Royal Society for the Protection <strong>of</strong> <strong><strong>Bird</strong>s</strong> (RSPB)is the UK charity working tosecure a healthy environment forbirds and other wildlife, helpingto create a better world for us all.<strong>The</strong> RSPB is the <strong>Bird</strong>Life Partnerin the UK. www.rspb.org.ukStatistics Netherlands (SN)is the <strong>of</strong>ficial Bureau <strong>of</strong> Statistics <strong>of</strong>the Netherlands and is responsible forcompiling statistics on a wide range <strong>of</strong>developments in society. SNcooperates closely with NGOs toproduce wildlife statistics. <strong>The</strong>sestatistics currently concern 14monitoring programmes, ranging from birds tobutterflies and plants. www.cbs.nl/en-GBCzech Society for Ornithology (CSO)is a non-governmental organisationwhich aims to perform, support andpromote research and conservation<strong>of</strong> wild living birds and their habitats.CSO is the <strong>Bird</strong>Life Partner in theCzech Republic. www.birdlife.cz27
PECBMS national data providersAustriaBelgiumBulgaryCzech RepublicDenmarkDenmarkDenmarkEstoniaFinlandFranceGermanyHungaryIrelandIrelandIrelandItalyItalyItalyItalyLatviaLatviaNetherlandsNorwayNorwayNorwayPolandPolandPortugalSpainSpainSwedenSwedenSwitzerlandUnited KingdomUnited KingdomUnited Kingdom