Recent Trends in Pinch Analysis for Carbon Emissions and ... - Aidic
Recent Trends in Pinch Analysis for Carbon Emissions and ... - Aidic
Recent Trends in Pinch Analysis for Carbon Emissions and ... - Aidic

Create successful ePaper yourself
Turn your PDF publications into a flip-book with our unique Google optimized e-Paper software.
CO2 emission<br />
Internal<br />
footpr<strong>in</strong>t<br />
External<br />
footpr<strong>in</strong>t<br />
<strong>Carbon</strong> <strong>in</strong>tensity benchmark<br />
Dem<strong>and</strong><br />
composite<br />
Source<br />
composite<br />
Adjusted<br />
source<br />
composite<br />
Cost Value added<br />
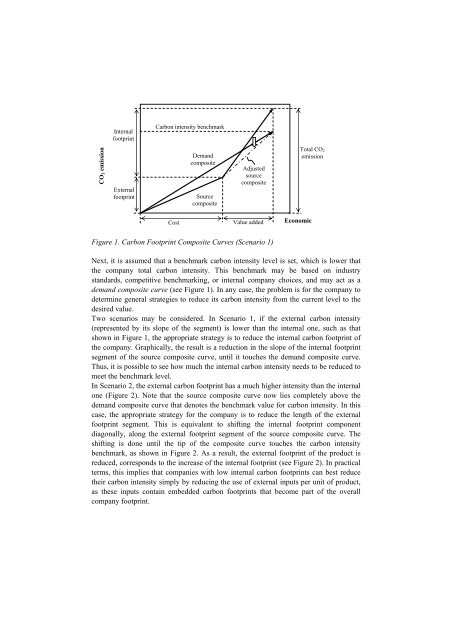
Figure 1. <strong>Carbon</strong> Footpr<strong>in</strong>t Composite Curves (Scenario 1)<br />
Economic<br />
Total CO2<br />
emission<br />
Next, it is assumed that a benchmark carbon <strong>in</strong>tensity level is set, which is lower that<br />
the company total carbon <strong>in</strong>tensity. This benchmark may be based on <strong>in</strong>dustry<br />
st<strong>and</strong>ards, competitive benchmark<strong>in</strong>g, or <strong>in</strong>ternal company choices, <strong>and</strong> may act as a<br />
dem<strong>and</strong> composite curve (see Figure 1). In any case, the problem is <strong>for</strong> the company to<br />
determ<strong>in</strong>e general strategies to reduce its carbon <strong>in</strong>tensity from the current level to the<br />
desired value.<br />
Two scenarios may be considered. In Scenario 1, if the external carbon <strong>in</strong>tensity<br />
(represented by its slope of the segment) is lower than the <strong>in</strong>ternal one, such as that<br />
shown <strong>in</strong> Figure 1, the appropriate strategy is to reduce the <strong>in</strong>ternal carbon footpr<strong>in</strong>t of<br />
the company. Graphically, the result is a reduction <strong>in</strong> the slope of the <strong>in</strong>ternal footpr<strong>in</strong>t<br />
segment of the source composite curve, until it touches the dem<strong>and</strong> composite curve.<br />
Thus, it is possible to see how much the <strong>in</strong>ternal carbon <strong>in</strong>tensity needs to be reduced to<br />
meet the benchmark level.<br />
In Scenario 2, the external carbon footpr<strong>in</strong>t has a much higher <strong>in</strong>tensity than the <strong>in</strong>ternal<br />
one (Figure 2). Note that the source composite curve now lies completely above the<br />
dem<strong>and</strong> composite curve that denotes the benchmark value <strong>for</strong> carbon <strong>in</strong>tensity. In this<br />
case, the appropriate strategy <strong>for</strong> the company is to reduce the length of the external<br />
footpr<strong>in</strong>t segment. This is equivalent to shift<strong>in</strong>g the <strong>in</strong>ternal footpr<strong>in</strong>t component<br />
diagonally, along the external footpr<strong>in</strong>t segment of the source composite curve. The<br />
shift<strong>in</strong>g is done until the tip of the composite curve touches the carbon <strong>in</strong>tensity<br />
benchmark, as shown <strong>in</strong> Figure 2. As a result, the external footpr<strong>in</strong>t of the product is<br />
reduced, corresponds to the <strong>in</strong>crease of the <strong>in</strong>ternal footpr<strong>in</strong>t (see Figure 2). In practical<br />
terms, this implies that companies with low <strong>in</strong>ternal carbon footpr<strong>in</strong>ts can best reduce<br />
their carbon <strong>in</strong>tensity simply by reduc<strong>in</strong>g the use of external <strong>in</strong>puts per unit of product,<br />
as these <strong>in</strong>puts conta<strong>in</strong> embedded carbon footpr<strong>in</strong>ts that become part of the overall<br />
company footpr<strong>in</strong>t.