Annual Report for FY 2005-2006 - JA Worldwide
Annual Report for FY 2005-2006 - JA Worldwide
Annual Report for FY 2005-2006 - JA Worldwide

You also want an ePaper? Increase the reach of your titles
YUMPU automatically turns print PDFs into web optimized ePapers that Google loves.
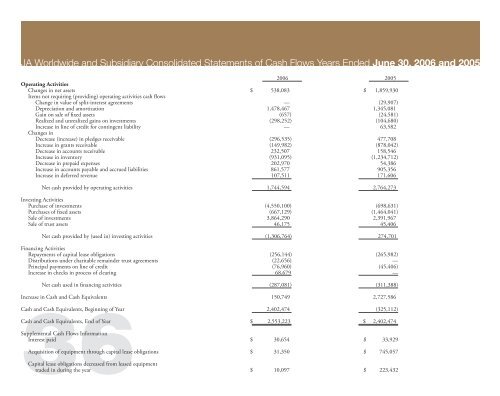
<strong>JA</strong> <strong>Worldwide</strong> and Subsidiary Consolidated Statements of Cash Flows Years Ended June 30, <strong>2006</strong> and <strong>2005</strong><br />
<strong>2006</strong> <strong>2005</strong><br />
Operating Activities<br />
Changes in net assets $ 538,083 $ 1,859,930<br />
Items not requiring (providing) operating activities cash flows<br />
Change in value of split-interest agreements — (29,907)<br />
Depreciation and amortization 1,478,467 1,345,081<br />
Gain on sale of fixed assets (657) (24,581)<br />
Realized and unrealized gains on investments (298,252) (104,680)<br />
Increase in line of credit <strong>for</strong> contingent liability<br />
Changes in<br />
— 63,582<br />
Decrease (increase) in pledges receivable (296,535) 477,708<br />
Increase in grants receivable (149,982) (878,042)<br />
Decrease in accounts receivable 232,507 158,546<br />
Increase in inventory (931,095) (1,234,712)<br />
Decrease in prepaid expenses 202,970 54,386<br />
Increase in accounts payable and accrued liabilities 861,577 905,356<br />
Increase in deferred revenue 107,511 171,606<br />
Net cash provided by operating activities 1,744,594 2,764,273<br />
Investing Activities<br />
Purchase of investments (4,550,100) (698,631)<br />
Purchases of fixed assets (667,129) (1,464,041)<br />
Sale of investments 3,864,290 2,391,967<br />
Sale of trust assets 46,175 45,406<br />
Net cash provided by (used in) investing activities (1,306,764) 274,701<br />
Financing Activities<br />
Repayments of capital lease obligations (256,144) (265,982)<br />
Distributions under charitable remainder trust agreements (22,656) —<br />
Principal payments on line of credit (76,960) (45,406)<br />
Increase in checks in process of clearing 68,679 —<br />
Net cash used in financing activities (287,081) (311,388)<br />
Increase in Cash and Cash Equivalents 150,749 2,727,586<br />
36<br />
Cash and Cash Equivalents, Beginning of Year 2,402,474 (325,112)<br />
Cash and Cash Equivalents, End of Year $ 2,553,223 $ 2,402,474<br />
Supplemental Cash Flows In<strong>for</strong>mation<br />
Interest paid $ 30,654 $ 33,929<br />
Acquisition of equipment through capital lease obligations $ 31,350 $ 745,057<br />
Capital lease obligations decreased from leased equipment<br />
traded in during the year $ 10,097 $ 223,432