Tourism Statistics Report
Tourism Statistics Report
Tourism Statistics Report

You also want an ePaper? Increase the reach of your titles
YUMPU automatically turns print PDFs into web optimized ePapers that Google loves.
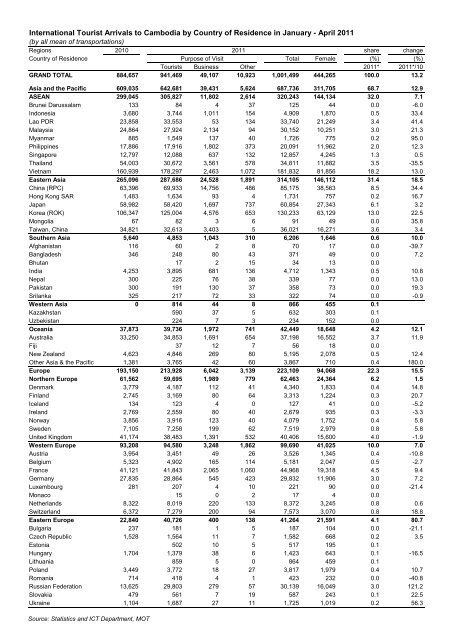
International Tourist Arrivals to Cambodia by Country of Residence in January - April 2011(by all mean of transportations)Regions 2010 2011 share changeCountry of Residence Purpose of Visit Total Female (%) (%)Tourists Business Other 2011* 2011*/10GRAND TOTAL 884,657 941,469 49,107 10,923 1,001,499 444,265 100.0 13.2Asia and the Pacific 609,035 642,681 39,431 5,624 687,736 311,705 68.7 12.9ASEAN 299,045 305,827 11,802 2,614 320,243 144,134 32.0 7.1Brunei Darussalam 133 84 4 37 125 44 0.0 -6.0Indonesia 3,680 3,744 1,011 154 4,909 1,870 0.5 33.4Lao PDR 23,858 33,553 53 134 33,740 21,249 3.4 41.4Malaysia 24,864 27,924 2,134 94 30,152 10,251 3.0 21.3Myanmar 885 1,549 137 40 1,726 775 0.2 95.0Philippines 17,886 17,916 1,802 373 20,091 11,962 2.0 12.3Singapore 12,797 12,088 637 132 12,857 4,245 1.3 0.5Thailand 54,003 30,672 3,561 578 34,811 11,882 3.5 -35.5Vietnam 160,939 178,297 2,463 1,072 181,832 81,856 18.2 13.0Eastern Asia 265,096 287,686 24,528 1,891 314,105 146,112 31.4 18.5China (RPC) 63,396 69,933 14,756 486 85,175 38,563 8.5 34.4Hong Kong SAR 1,483 1,634 93 4 1,731 757 0.2 16.7Japan 58,982 58,420 1,697 737 60,854 27,343 6.1 3.2Korea (ROK) 106,347 125,004 4,576 653 130,233 63,129 13.0 22.5Mongolia 67 82 3 6 91 49 0.0 35.8Taiwan, China 34,821 32,613 3,403 5 36,021 16,271 3.6 3.4Southern Asia 5,640 4,853 1,043 310 6,206 1,646 0.6 10.0Afghanistan 116 60 2 8 70 17 0.0 -39.7Bangladesh 346 248 80 43 371 49 0.0 7.2Bhutan 17 2 15 34 13 0.0India 4,253 3,895 681 136 4,712 1,343 0.5 10.8Nepal 300 225 76 38 339 77 0.0 13.0Pakistan 300 191 130 37 358 73 0.0 19.3Srilanka 325 217 72 33 322 74 0.0 -0.9Western Asia 0 814 44 8 866 455 0.1Kazakhstan 590 37 5 632 303 0.1Uzbekistan 224 7 3 234 152 0.0Oceania 37,873 39,736 1,972 741 42,449 18,648 4.2 12.1Australia 33,250 34,853 1,691 654 37,198 16,552 3.7 11.9Fiji 37 12 7 56 18 0.0New Zealand 4,623 4,846 269 80 5,195 2,078 0.5 12.4Other Asia & the Pacific 1,381 3,765 42 60 3,867 710 0.4 180.0Europe 193,150 213,928 6,042 3,139 223,109 94,068 22.3 15.5Northern Europe 61,562 59,695 1,989 779 62,463 24,364 6.2 1.5Denmark 3,779 4,187 112 41 4,340 1,833 0.4 14.8Finland 2,745 3,169 80 64 3,313 1,224 0.3 20.7Iceland 134 123 4 0 127 41 0.0 -5.2Ireland 2,769 2,559 80 40 2,679 935 0.3 -3.3Norway 3,856 3,916 123 40 4,079 1,752 0.4 5.8Sweden 7,105 7,258 199 62 7,519 2,979 0.8 5.8United Kingdom 41,174 38,483 1,391 532 40,406 15,600 4.0 -1.9Western Europe 93,208 94,580 3,248 1,862 99,690 41,025 10.0 7.0Austria 3,954 3,451 49 26 3,526 1,345 0.4 -10.8Belgium 5,323 4,902 165 114 5,181 2,047 0.5 -2.7France 41,121 41,843 2,065 1,060 44,968 19,318 4.5 9.4Germany 27,835 28,864 545 423 29,832 11,906 3.0 7.2Luxembourg 281 207 4 10 221 90 0.0 -21.4Monaco 15 0 2 17 4 0.0Netherlands 8,322 8,019 220 133 8,372 3,245 0.8 0.6Switzerland 6,372 7,279 200 94 7,573 3,070 0.8 18.8Eastern Europe 22,840 40,726 400 138 41,264 21,591 4.1 80.7Bulgaria 237 181 1 5 187 104 0.0 -21.1Czech Republic 1,528 1,564 11 7 1,582 668 0.2 3.5Estonia 502 10 5 517 195 0.1Hungary 1,704 1,379 38 6 1,423 643 0.1 -16.5Lithuania 859 5 0 864 459 0.1Poland 3,449 3,772 18 27 3,817 1,979 0.4 10.7Romania 714 418 4 1 423 232 0.0 -40.8Russian Federation 13,625 29,803 279 57 30,139 16,049 3.0 121.2Slovakia 479 561 7 19 587 243 0.1 22.5Ukraine 1,104 1,687 27 11 1,725 1,019 0.2 56.3Source: <strong>Statistics</strong> and ICT Department, MOT