JACC Vol. 57, No. 2, 2011January 11, 2011:184–94Perez-David et al.VT Substrate and Heterogeneous Tissue Mapping185heterogeneous tissue (HT) (9). The extension <strong>of</strong> HT correlateswith increased cardiac mortality and VT inducibility (9,10).We also know that HT is not necessarily confined to the border<strong>of</strong> the infarct, and that it can be seen at more central locations (10),as occurs with CC (4).We hypothesized that SMVT substrate are channels <strong>of</strong> HTthat could be identified noninvasively by ceMRI. The purposes<strong>of</strong> the study were as follows: 1) to differentiate patients withand without spontaneous SMVT based on the presence orabsence <strong>of</strong> HT channels; and 2) to identify CC by projectingthe endocardial SI <strong>of</strong> ceMRI in a 3-dimensional (3D) endocardialshell.MethodsPatientsSMVT group. We included 18 consecutive patients referredfor ablation <strong>of</strong> SMVT who fulfilled the followinginclusion criteria: 1) chronic myocardial infarction; 2) clinicallydocumented SMVT; and 3) no contraindication forMRI, including the presence <strong>of</strong> an implantable cardioverterdefibrillator(ICD). All 18 patients with SMVT underwentclinical evaluation and MRI, followed by an electrophysiologicalstudy.Control group. The SMVT group was compared with acontrol group selected from the MRI database. Participantswere matched for age, sex, left ventricular ejection fraction,and infarct location, but did not have clinically documentedVT, palpitation, or syncope. The study was performedaccording to local guidelines on ethics and methodology <strong>of</strong>clinical investigation. Informed consent was obtained fromall participants.MRIStudy and control patients underwent ceMRI with a 1.5-Tscanner (Intera, Philips, Best, the Netherlands). A5-element dedicated cardiac coil was used. All images wereobtained with electrocardiogram gating and breath-holding.The MRI study consisted <strong>of</strong> cine steady-state freeprecessionimaging <strong>of</strong> left ventricular function (SENSE 2, repetition time: 2.4 ms, echo time: 1.2 ms, averagein-plane spatial resolution: 1.6 2 mm, 30 phases per cycle,8-mm slice thickness without gap) and late enhancementimaging <strong>of</strong> myocardial scar tissue (3D inversion-recoveryturbo gradient echo sequence, pre-pulse delay optimized formaximal myocardial signal suppression; SENSE 2, flipangle 15°, repetition time: 3.4 ms, echo time: 1.3 ms, actualspatial resolution: 1.48 1.66 mm, interpolated spatialresolution 1.29 1.29 mm, 5-mm actual slice thickness,inversion time: 200 to 300 ms; acquisition window was setto 150 to 170 ms and breath-holding length was 13 to 14 sdepending on heart rate). Both cine images and late enhancementimages were obtained in the same short-axisviews (10 to 14 contiguous slices) and 4-, 2-, and 3-chamberviews. Late enhancement was performed 10 to 15 min aftera total injection <strong>of</strong> 0.2 mmol/kggadodiamide (Omniscan, GEHealthcare, Oslo, Norway).Electrophysiological StudyElectrophysiologists were blindedto the results <strong>of</strong> ceMRI. The electrophysiologicalstudy has beendescribed elsewhere (4). Briefly,once written informed consentwas obtained, VT patients underwentan electrophysiologicalstudy in the post-absorptive state4 7 days after ceMRI. At least2 quadripolar catheters wereplaced in the bundle <strong>of</strong> His andright ventricular apex or right ventricularoutflow tract.Left ventricle mapping. Detailedendocardial mapping wasperformed during sinus rhythmAbbreviationsand Acronyms3D 3-dimensionalCC conduction channelsceMRI contrastenhancedmagneticresonance imagingHT heterogeneous tissueICD implantablecardioverter-defibrillatorMRI magnetic resonanceimagingRF radi<strong>of</strong>requencySI signal intensitySMVT sustainedmonomorphic ventriculartachycardiaVT ventriculartachycardiaor right ventricular apex pacing at 600 ms. Mapping andablation was performed using the CARTO magnetic mappingsystem (Biosense, Inc., Diamond Bar, California) withthe Navistar Thermocool catheter (Biosense, Inc.). Todefine the presence <strong>of</strong> CC, several sites were explored toobtain a fill threshold <strong>of</strong> 10 mm in the zone <strong>of</strong> interestwithin the low voltage area, so that the distance betweenmapped sites was 1 cm.RF ablation procedure. Radi<strong>of</strong>requency (RF) ablation wasperformed with a 550-kHz RF Stockert-Cordis generator.The RF energy was delivered in a temperature-controlledmode for 60 to 120 s at each ablation site with a maximaltemperature target <strong>of</strong> 45°C and 35 to 40 W <strong>of</strong> maximumpower delivered.The end points <strong>of</strong> the procedure were as follows: 1) suppression<strong>of</strong> induced clinical VT; and/or 2) disappearance <strong>of</strong>clinical VT-related CC or electrograms with delayed componentsin those patients with unmappable VT. Heparinwas infused throughout the procedure. An ICD was implantedin all patients after the procedure.Data AnalysisThe MRI data were analyzed by 2 investigators (E.P.D. andV.C.), who were blinded to VT morphology, electrophysiologystudy results, and participant group (SMVT orcontrol). Cine and late enhancement images were analyzed<strong>of</strong>fline in DICOM (Digital Imaging and Communicationsin Medicine) format with specialized s<strong>of</strong>tware (QMass MRversion 7.0, MEDIS, the Netherlands). Left ventricularend-diastolic and end-systolic volumes were assessed accordingto Simpson’s rule, and the ejection fraction wascalculated. Left ventricular mass was calculated by subtractingthe endocardial volume from the epicardial volume atend diastole and then multiplying by the tissue density(1.05 g/ml).
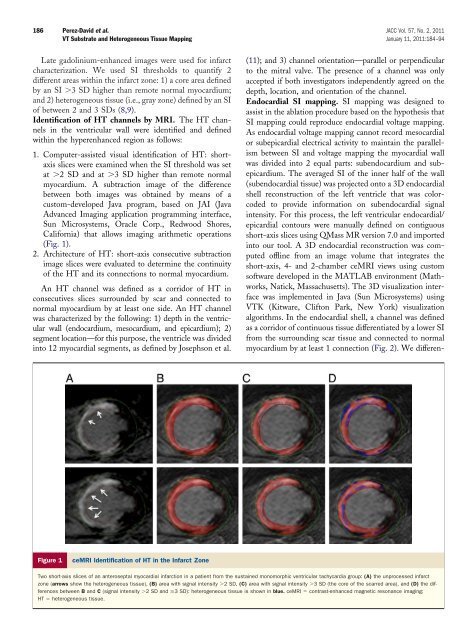
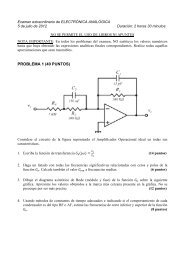
186 Perez-David et al. JACC Vol. 57, No. 2, 2011VT Substrate and Heterogeneous Tissue Mapping January 11, 2011:184–94Late gadolinium-enhanced images were used for infarctcharacterization. We used SI thresholds to quantify 2different areas within the infarct zone: 1) a core area definedby an SI 3 SD higher than remote normal myocardium;and 2) heterogeneous tissue (i.e., gray zone) defined by an SI<strong>of</strong> between 2 and 3 SDs (8,9).<strong>Identification</strong> <strong>of</strong> HT channels by MRI. The HT channelsin the ventricular wall were identified and definedwithin the hyperenhanced region as follows:1. Computer-assisted visual identification <strong>of</strong> HT: shortaxisslices were examined when the SI threshold was setat 2 SD and at 3 SD higher than remote normalmyocardium. A subtraction image <strong>of</strong> the differencebetween both images was obtained by means <strong>of</strong> acustom-developed Java program, based on JAI (JavaAdvanced Imaging application programming interface,Sun Microsystems, Oracle Corp., Redwood Shores,California) that allows imaging arithmetic operations(Fig. 1).2. Architecture <strong>of</strong> HT: short-axis consecutive subtractionimage slices were evaluated to determine the continuity<strong>of</strong> the HT and its connections to normal myocardium.An HT channel was defined as a corridor <strong>of</strong> HT inconsecutives slices surrounded by scar and connected tonormal myocardium by at least one side. An HT channelwas characterized by the following: 1) depth in the ventricularwall (endocardium, mesocardium, and epicardium); 2)segment location—for this purpose, the ventricle was dividedinto 12 myocardial segments, as defined by Josephson et al.(11); and 3) channel orientation—parallel or perpendicularto the mitral valve. The presence <strong>of</strong> a channel was onlyaccepted if both investigators independently agreed on thedepth, location, and orientation <strong>of</strong> the channel.Endocardial SI mapping. SI mapping was designed toassist in the ablation procedure based on the hypothesis thatSI mapping could reproduce endocardial voltage mapping.As endocardial voltage mapping cannot record mesocardialor subepicardial electrical activity to maintain the parallelismbetween SI and voltage mapping the myocardial wallwas divided into 2 equal parts: subendocardium and subepicardium.The averaged SI <strong>of</strong> the inner half <strong>of</strong> the wall(subendocardial tissue) was projected onto a 3D endocardialshell reconstruction <strong>of</strong> the left ventricle that was colorcodedto provide information on subendocardial signalintensity. For this process, the left ventricular endocardial/epicardial contours were manually defined on contiguousshort-axis slices using QMass MR version 7.0 and importedinto our tool. A 3D endocardial reconstruction was computed<strong>of</strong>fline from an image volume that integrates theshort-axis, 4- and 2-chamber ceMRI views using customs<strong>of</strong>tware developed in the MATLAB environment (Mathworks,Natick, Massachusetts). The 3D visualization interfacewas implemented in Java (Sun Microsystems) usingVTK (Kitware, Clifton Park, New York) visualizationalgorithms. In the endocardial shell, a channel was definedas a corridor <strong>of</strong> continuous tissue differentiated by a lower SIfrom the surrounding scar tissue and connected to normalmyocardium by at least 1 connection (Fig. 2). We differen-Figure 1ceMRI <strong>Identification</strong> <strong>of</strong> HT in the Infarct ZoneTwo short-axis slices <strong>of</strong> an anteroseptal myocardial infarction in a patient from the sustained monomorphic ventricular tachycardia group: (A) the unprocessed infarctzone (arrows show the heterogeneous tissue), (B) area with signal intensity 2 SD, (C) area with signal intensity 3 SD (the core <strong>of</strong> the scarred area), and (D) the differencesbetween B and C (signal intensity 2 SDand3 SD): heterogeneous tissue is shown in blue. ceMRI contrast-enhanced magnetic resonance imaging;HT heterogeneous tissue.