mgn5pn8
mgn5pn8
mgn5pn8

You also want an ePaper? Increase the reach of your titles
YUMPU automatically turns print PDFs into web optimized ePapers that Google loves.
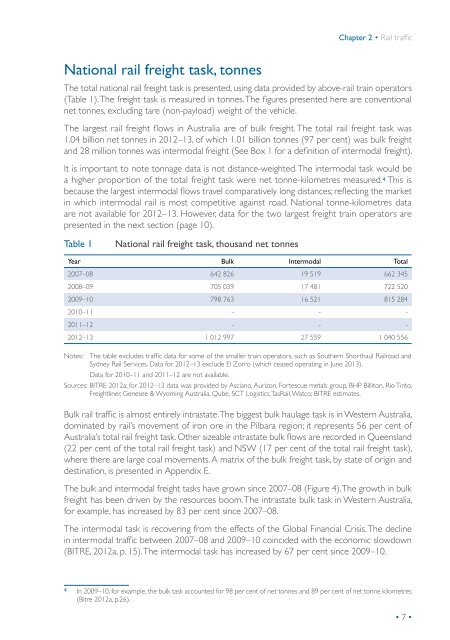
Chapter 2 • Rail trafficNational rail freight task, tonnesThe total national rail freight task is presented, using data provided by above-rail train operators(Table 1). The freight task is measured in tonnes. The figures presented here are conventionalnet tonnes, excluding tare (non-payload) weight of the vehicle.The largest rail freight flows in Australia are of bulk freight. The total rail freight task was1.04 billion net tonnes in 2012–13, of which 1.01 billion tonnes (97 per cent) was bulk freightand 28 million tonnes was intermodal freight (See Box 1 for a definition of intermodal freight).It is important to note tonnage data is not distance-weighted. The intermodal task would bea higher proportion of the total freight task were net tonne-kilometres measured. 4 This isbecause the largest intermodal flows travel comparatively long distances; reflecting the marketin which intermodal rail is most competitive against road. National tonne-kilometres dataare not available for 2012–13. However, data for the two largest freight train operators arepresented in the next section (page 10).Table 1National rail freight task, thousand net tonnesYear Bulk Intermodal Total2007–08 642 826 19 519 662 3452008–09 705 039 17 481 722 5202009–10 798 763 16 521 815 2842010–11 - - -2011–12 - - -2012–13 1 012 997 27 559 1 040 556Notes: The table excludes traffic data for some of the smaller train operators, such as Southern Shorthaul Railroad andSydney Rail Services. Data for 2012–13 exclude El Zorro (which ceased operating in June 2013).Data for 2010–11 and 2011–12 are not available.Sources: BITRE 2012a; for 2012–13 data was provided by Asciano, Aurizon, Fortescue metals group, BHP Billiton, Rio Tinto,Freightliner, Genesee & Wyoming Australia, Qube, SCT Logistics, TasRail, Watco; BITRE estimates.Bulk rail traffic is almost entirely intrastate. The biggest bulk haulage task is in Western Australia,dominated by rail’s movement of iron ore in the Pilbara region; it represents 56 per cent ofAustralia’s total rail freight task. Other sizeable intrastate bulk flows are recorded in Queensland(22 per cent of the total rail freight task) and NSW (17 per cent of the total rail freight task),where there are large coal movements. A matrix of the bulk freight task, by state of origin anddestination, is presented in Appendix E.The bulk and intermodal freight tasks have grown since 2007–08 (Figure 4). The growth in bulkfreight has been driven by the resources boom. The intrastate bulk task in Western Australia,for example, has increased by 83 per cent since 2007–08.The intermodal task is recovering from the effects of the Global Financial Crisis. The declinein intermodal traffic between 2007–08 and 2009–10 coincided with the economic slowdown(BITRE, 2012a, p. 15). The intermodal task has increased by 67 per cent since 2009–10.4 In 2009–10, for example, the bulk task accounted for 98 per cent of net tonnes and 89 per cent of net tonne kilometres(Bitre 2012a, p.26).• 7 •