270 Exp Brain Res (2008) 184:269–273matches behavioral results: the antiphase pattern wasjudged more variable than the in-phase pattern, and relativephase was judged more variable as the movement frequencyincreased (Bingham et al. 1999, 2001; Zaal et al.2000). On the basis <strong>of</strong> those results, Bingham (2001,2004a, 2004b) proposed a dynamical model that capturesthe results <strong>of</strong> both behavioral and perception studies.Central to this model is the coupling <strong>of</strong> two phase drivenoscillators via the perceived relative phase, the resolution<strong>of</strong> which is determined by relative velocity. In the presentstudy, we specifically test behavioral predictions from thislast assumption <strong>of</strong> the model, i.e., that instability in relativephase coordination is brought about by relative velocitythat affects the resolution <strong>of</strong> the perceived relative phase.This was achieved by manipulating selectively relativephase and relative velocity during a unimanual <strong>visuo</strong>-<strong>motor</strong><strong>tracking</strong> task.Bingham’s model is as follows:€x i þ b _x i þ kx i ¼ c sinð/ j ÞP ij€x j þ b _x j þ kx j ¼ c sinð/ i ÞP ji ð1Þwhere x i and / i are the position and phase <strong>of</strong> oscillator i,respectively, and the dots de<strong>not</strong>e the first and secondderivatives. Each oscillator is driven by the perceivedphase <strong>of</strong> the other oscillator multiplied by a term Prepresenting perceived relative phase:P ji ¼ sign sinð/ i Þ sinð/ j Þþað _x i _x j ÞN t ð2ÞP (i.e. ± 1) is the sign <strong>of</strong> the product <strong>of</strong> the two driversincremented by a Gaussian noise term with a variance thatis proportional to the velocity difference between theoscillators.In the absence <strong>of</strong> noise, P = +1 ensures an in-phasepattern <strong>of</strong> coordination, whereas P = -1 ensures theopposite (antiphase) pattern. While the velocity differenceis minimal during the production <strong>of</strong> the in-phase pattern <strong>of</strong>coordination between oscillatory movements <strong>of</strong> similaramplitude (Fig. 1b1), it is oscillating at a maximal amplitudefor the antiphase behavior (Fig. 1b2); a noise term thatis function <strong>of</strong> this difference (Fig. 1c2) will therefore affectP (Fig. 1d2) and the stability <strong>of</strong> the resulting behavior. Asthe velocity signals increase with frequency, so do thevelocity difference and the resulting noise, leading to afurther increased variability <strong>of</strong> the behavior. Note that theuse <strong>of</strong> non-normalized velocity in Eq. 2 is crucial here,since normalizing velocity would prevent the increase invariability the model was precisely designed to reproduce.These features are illustrated in Fig. 2a together with predictionsfrom Bingham’s model in response to our selectivemanipulation <strong>of</strong> relative phase and relative velocity. Thisselective manipulation was achieved via the modulation <strong>of</strong>the amplitude <strong>of</strong> one <strong>of</strong> the two oscillations only: Bymultiplying the amplitude <strong>of</strong> one movement by three, thevelocity difference obtained during an in-phase behavior(Fig. 1b3) is similar to that <strong>of</strong> the antiphase behavior performedwith similar amplitudes (Fig. 1b2). According toBingham’s model, those two conditions should thereforeproduce similar variability pr<strong>of</strong>iles (Fig. 2a). Furthermore,the velocity difference obtained during an antiphase coordinationperformed with different amplitudes (Fig. 1c4) ishigher than that obtained with similar amplitudes (Fig. 1c2). According to Bingham’s model, the variability <strong>of</strong> thebehavior should therefore be higher in the former conditionas compared with the latter (Fig. 2a). If the mechanismsinvolved in the studied coordination are independent <strong>of</strong> therelative velocity, however, our manipulation <strong>of</strong> movementamplitude should have little effect on the behavior; i.e., theknown effects <strong>of</strong> phase and frequency should be observed,but different amplitudes should <strong>not</strong> affect relative phasevariability (Fig. 2b).We tested those predictions during a unimanual <strong>visuo</strong><strong>motor</strong><strong>tracking</strong> task that permitted to keep the amplitude <strong>of</strong>the participants’ movement constant while manipulatingsolely the amplitude and frequency <strong>of</strong> the target to track(either in-phase or antiphase).Materials and methodsSix participants (four males and two females, aged 21–28)volunteered for this experiment. All were right handed withnormal or corrected to normal vision. Participants werenaive to the purpose <strong>of</strong> the experiment. They all gaveinformed consent prior to experiment, which was approvedby the local ethics committee and conformed to the Declaration<strong>of</strong> Helsinki.Each participant sat in a chair 70 cm from a computerdisplay positioned at eye level. With their right hand,participants grasped a handle fixed to a rotating horizontalshaft (instrumented to record angular displacement at asampling rate <strong>of</strong> 100 Hz) adjacent to the ulna. Pronation–supination movement resulted in the higher part <strong>of</strong> thehandle to move right–left from the middle position definedby the vertical (forearm mid-prone).The angular displacement <strong>of</strong> the handle controlled byparticipants was displayed online on the screen as a linearhorizontal displacement <strong>of</strong> a white ball moving in the samedirection as the higher part <strong>of</strong> the handle. An amplitude A1<strong>of</strong> 3.4 cm (corresponding to an angular displacement <strong>of</strong> thehandle <strong>of</strong> 62°) was prescribed by two thin vertical linesbetween which the participants were required to oscillate.Four centimeters above the ‘‘handle’’ ball was a ‘‘target’’(also white) ball moving according to an imposed sinusoidalhorizontal displacement. The white balls (1.7 cmdiameter) were presented on a dark background. To ensure123
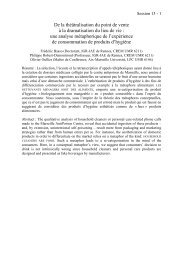
Exp Brain Res (2008) 184:269–273 271Fig. 1 a The positions (in arbitrary unit) <strong>of</strong> two oscillatory objectsfor the combinations <strong>of</strong> two conditions <strong>of</strong> relative phase [in-phase(IN) and antiphase (ANTI)] and amplitude (A1 same amplitudes; A2one oscillation has an amplitude <strong>of</strong> three times the other). Rows 1–4correspond to condition IN-A1, ANTI-A1, IN-A2, and ANTI-A2,respectively. b–d Corresponding components <strong>of</strong> the coupling functionthat only the stimulus displayed on the screen could beseen, the experiment was performed in the dark and participantswore soldering glasses. This visual display wasdesigned to be as close as possible to that reported in thestudies conducted by Bingham and colleagues on the perception<strong>of</strong> relative phase (Bingham et al. 1999, 2001; Zaalet al. 2000).Participants were instructed to synchronize their oscillation(handle ball) either in-phase (IN) or antiphase(ANTI) with the oscillation <strong>of</strong> the target dot. In the INcondition, the handle ball had to move in the same directionas the target ball, and in the ANTI condition, it had tomove in the opposite direction. While the amplitude <strong>of</strong> thehandle ball’s displacement was always prescribed at3.4 cm, the amplitude <strong>of</strong> the target’s displacement waseither 3.4 cm (condition A1) or three times 3.4 cm (i.e,10.2 cm, condition A2). Three frequencies were employed:in Bingham’s model (Eq. 2). b Relative velocity ð _x i _x j Þ; c product(prod) <strong>of</strong> the drivers incremented by a Gaussian noise with a varianceproportional to the velocity difference (i.e., prod ¼ sinð/ i Þsinð/ j Þþað _x i _x j ÞN t ; with a = 0.0015); d sign <strong>of</strong> prod (i.e., Pin Eq. 2)0.75, 1.25, and 1.75 Hz. After a few practice trials, theacquisition session consisted <strong>of</strong> five trials <strong>of</strong> 35 s performedin each <strong>of</strong> the 12 conditions [phase(2) 9 amplitude (2) 9 frequency (3)], presented in a fullyrandomized order.Continuous relative phase was determined in phasespace, i.e., the space spanned between position and velocityfor each oscillation. The angular velocity obtained by differentiation<strong>of</strong> angular position was normalized by dividingthe velocity signal by the mean frequency. Next, the phaseangles were computed for each sample <strong>of</strong> oscillatorymovement as the arctangent <strong>of</strong> the position and velocity.Mean circular relative phase w was then determined usingcircular statistics (Fisher 1993). To this end, the cosine andsine <strong>of</strong> the difference between the phase angle for thehandle and the target were averaged separately, and w wasobtained as the arctangent <strong>of</strong> their ratio (for more detail,123