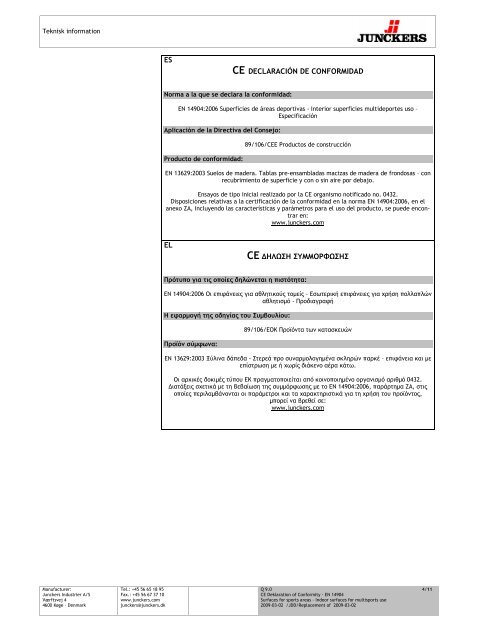
CE Declaration CE Deklaration of Conformity - EN 14904 ... - Junckers
CE Declaration CE Deklaration of Conformity - EN 14904 ... - Junckers
CE Declaration CE Deklaration of Conformity - EN 14904 ... - Junckers
Create successful ePaper yourself
Turn your PDF publications into a flip-book with our unique Google optimized e-Paper software.
224 K. You, H. Zhan / Advances in Water Resources 52 (2013) 221–2313. Field applicationIn this section, the developed model 1D-VT is applied to interpreta field study <strong>of</strong> T<strong>CE</strong> transport in natural attenuation at PicatinnyArsenal in Morris County, New Jersey, USA. About1.26 10 5 m 2 <strong>of</strong> the unconfined aquifer at this site was contaminatedby T<strong>CE</strong> with a concentration <strong>of</strong> greater than 10 mg L 1resulting from improper disposal practices <strong>of</strong> metal degreasingand cleaning operations from 1960 to 1981 [29]. Extensive fieldstudies have been conducted to investigate the T<strong>CE</strong> contaminationin the unsaturated zone at the site. The unsaturated zone mainlyconsists <strong>of</strong> medium-to-coarse sand with organic carbon contentranging from 0.080% to 1.020% [29]. The sampling event took placein 1998 at a site where the unsaturated zone had an average thickness<strong>of</strong> 3.2 m, a porosity <strong>of</strong> 0.32 and an average moisture content <strong>of</strong>0.117 [29]. No precipitation occurred during the sampling period,and the magnitude <strong>of</strong> the water table fluctuation was less than2cm[29]. The detailed site and sampling information can be foundin Smith et al. [36] and Choi et al. [29].In our study, the molecular weight, dimensionless Henry’s lawconstant, organic carbon partition coefficient and gas phase diffusioncoefficient <strong>of</strong> T<strong>CE</strong> are set to 131.4 g mol 1 , 0.28,0.735 m 3 Kg 1 and 0.0787 cm 2 s 1 , respectively, as can be foundfrom Chiao et al. [43]. T<strong>CE</strong> gas phase concentration at the water tableis set to be 2 mg L 1 , and initially it decreases linearly to 0 atthe ground surface with a constant concentration gradient <strong>of</strong>0.625 mg L 1 m 1 , as used by Choi et al. [29]. Besides the dataabove, the gas phase permeability and the period and magnitude<strong>of</strong> the water table fluctuation are also required to predict the transport<strong>of</strong> T<strong>CE</strong> in the unsaturated zone. We used the atmosphericpressure data from August 19 to 21 in 1998 for this site and thecorresponding subsurface pressure data at the depth <strong>of</strong> 2.45 m toconduct parameter optimization to search for the optimal valuesfor the gas phase permeability k g , the magnitude A 2 and periodT 2 <strong>of</strong> the water table fluctuation. The simplex method is employedto do the parameter optimization because <strong>of</strong> its simplicity and rapidconvergence [11,12]. In order to obtain an unique pair <strong>of</strong> results,a good initial guess <strong>of</strong> the parameters to be optimized isindispensable [11,12]. We set the initial values <strong>of</strong> k g , A 2 and T 2 to3.5 10 14 m 2 , 0.01 m and 1 day, respectively, which are basedon the estimated and field observed data in Choi et al. [29].Fig. 1 shows the comparison <strong>of</strong> the measured and predictedsubsurface gas pressures at the depth <strong>of</strong> 2.45 m. The predicted subsurfacegas pressures are calculated using the optimal values <strong>of</strong> k g ,A 2 and T 2 , which are 3.8 10 14 m 2 , 0.001 m and 0.8 days, respectively.These values are close to those estimated by Choi et al. [29].As shown in Fig. 1, by taking into account the water table fluctuationthe predicted and measured subsurface gas pressures matchbetter with each other than those in Choi et al. [29]. The root meansquare error is 21 Pa, which is only 0.021% <strong>of</strong> the average total gaspressure. This demonstrates the accuracy <strong>of</strong> the developed solution1D-VT.Fig. 2 shows the change <strong>of</strong> the gas phase concentration <strong>of</strong> T<strong>CE</strong>with time at the depth <strong>of</strong> 0.16, 1.6 and 3.0 m, respectively, whichare drawn with the same scales. At the shallow depth (Fig. 2(a)),the change <strong>of</strong> the concentration is mainly controlled by the atmosphericpressure fluctuation. During this brief time period, theincreasing atmospheric pressure causes the downward pressuredriven flux, which decreases the gas phase concentration, and viceversa. At the depth close to the water table (Fig. 2(c)), the change <strong>of</strong>the concentration is mainly controlled by the water table fluctuation.The upward moving water table increases the gas phase concentrationthere, while the downward moving water tabledecreases it. At the middle depth (Fig. 2(b)), because both theatmospheric pressure and water table fluctuations are retarded,the gas phase concentration fluctuates slightly there.Fig. 3 compares the change <strong>of</strong> the diffusive and advective fluxeswith time at the depth <strong>of</strong> 0.16 m. According to Fig. 3, both the diffusiveand the advective fluxes fluctuate with the fluctuations <strong>of</strong>the atmospheric pressure and water table. The change <strong>of</strong> the diffusiveflux is contrary to that <strong>of</strong> the gas phase concentration at thesame depth (z = 0.16 m) (Fig. 2(a) and Fig. 3(a)). The increasingatmospheric pressure leads to the decreased gas phase concentrationand increased concentration gradient at the shallow depth,which increases the upward diffusive flux, and vice versa. Themagnitude <strong>of</strong> the advective flux is about one order <strong>of</strong> magnitudeless than the diffusive flux. However, the variation in diffusive fluxis much smaller than that <strong>of</strong> the advective flux. Fig. 4 displays thedepth distribution <strong>of</strong> the two-day averaged diffusive and advectivefluxes. The averaged advective flux has a maximum value at themiddle depth (z = 2 m). During these two days, the net contribution<strong>of</strong> the advective flux is to move T<strong>CE</strong> downward toward the watertable. The averaged diffusive flux is constant across the depth exceptat the place close to the water table and ground surface, wherethe averaged diffusive flux decreases. As seen from Fig. 2, duringmost <strong>of</strong> the time in these two days, the gas phase concentration<strong>of</strong> T<strong>CE</strong> close to the ground surface is lower than its initial value,while that close to the water table is higher than its initial value.At the same time, the concentrations <strong>of</strong> T<strong>CE</strong> at the boundariesare fixed to be constants. Therefore, the concentration gradientsclose to the two boundaries decrease, which results in decreasedaverage diffusive fluxes there. The averaged diffusive flux is abouttwo orders <strong>of</strong> magnitude greater than the averaged advective flux.Although the transient advective flux may be great, the net contribution<strong>of</strong> the advective flux induced by atmospheric pressure andwater table fluctuations can be neglected compared with thediffusive flux.1.006 x 105 t (day)1.005Pressure (Pa)1.0041.0031.0021.001calculated pressure at 2.45 mmeasured pressure at 2.45 m1atmospheric pressurecalculated pressure at 2.45 m by Choi et al., 20020.9990 0.5 1 1.5 2Fig. 1. Comparison <strong>of</strong> the calculated and field measured subsurface gas pressures atthe depth <strong>of</strong> 2.45 m at Picatinny Arsenal in Morris County, New Jersey, USA.Concentration (mg L -1 )0.10010.09980.09951.00020.99990.99961.9004(a) z=0.16 m(b) z=1.6 m1.9001(c) z=3.0 m1.89980 0.2 0.4 0.6 0.8 1 1.2 1.4 1.6 1.8 2t (day)Fig. 2. Change <strong>of</strong> the gas phase concentration <strong>of</strong> T<strong>CE</strong> with time at (a) z = 0.16 m, (b)z = 1.6 m, and (c) z = 3.0 m.


