

evaluation-pest-wasps-nz
evaluation-pest-wasps-nz
evaluation-pest-wasps-nz

Create successful ePaper yourself
Turn your PDF publications into a flip-book with our unique Google optimized e-Paper software.
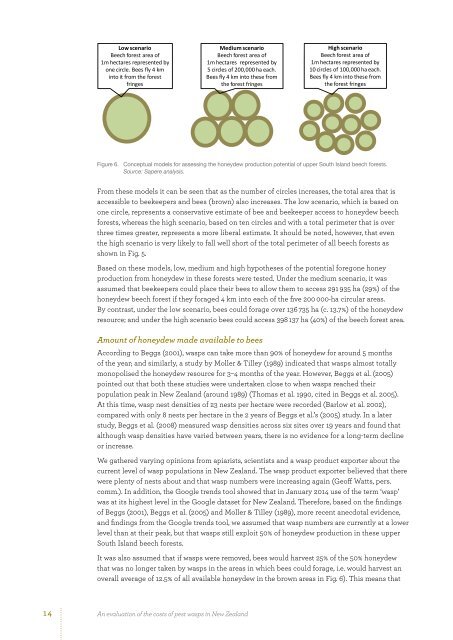
Low scenario Low Low scenario scenarioBeech forest Beech Beech area forest forest of area area of ofMedium Medium scenario Medium scenario scenarioBeech forest Beech Beech area forest forest of area area of ofHigh scenario High High scenario scenarioBeech forest Beech Beech area forest forest of area area of of1m hectares 1m hectares 1m represented hectares represented by by 1m by hectares 1m hectares 1m represented hectares represented by by by 1m hectares 1m hectares 1m represented hectares represented by by byone circle. one Bees one circle. circle. fly Bees 4 km Bees fly 4 fly km 4 km 5 circles 5 of circles 200,000 5 circles of 200,000 of ha 200,000 each. ha each. ha each. 10 circles 10 of circles 10 100,000 circles of 100,000 of ha 100,000 each. ha each. ha each.into it from into into it the from it forest from the forest the forest Bees fly Bees 4 km Bees fly into 4 fly km these 4 into km from into these these from from Bees fly Bees 4 km Bees fly into 4 fly km these 4 into km from into these these from fromfringes fringes fringesthe forest the fringes forest the forest fringes fringes the forest the fringes forest the forest fringes fringesFigure 6. Conceptual models for assessing the honeydew production potential of upper South Island beech forests.Source: Sapere analysis.From these models it can be seen that as the number of circles increases, the total area that isaccessible to beekeepers and bees (brown) also increases. The low scenario, which is based onone circle, represents a conservative estimate of bee and beekeeper access to honeydew beechforests, whereas the high scenario, based on ten circles and with a total perimeter that is overthree times greater, represents a more liberal estimate. It should be noted, however, that eventhe high scenario is very likely to fall well short of the total perimeter of all beech forests asshown in Fig. 5.Based on these models, low, medium and high hypotheses of the potential foregone honeyproduction from honeydew in these forests were tested. Under the medium scenario, it wasassumed that beekeepers could place their bees to allow them to access 291 935 ha (29%) of thehoneydew beech forest if they foraged 4 km into each of the five 200 000-ha circular areas.By contrast, under the low scenario, bees could forage over 136 735 ha (c. 13.7%) of the honeydewresource; and under the high scenario bees could access 398 137 ha (40%) of the beech forest area.Amount of honeydew made available to beesAccording to Beggs (2001), <strong>wasps</strong> can take more than 90% of honeydew for around 5 monthsof the year; and similarly, a study by Moller & Tilley (1989) indicated that <strong>wasps</strong> almost totallymonopolised the honeydew resource for 3–4 months of the year. However, Beggs et al. (2005)pointed out that both these studies were undertaken close to when <strong>wasps</strong> reached theirpopulation peak in New Zealand (around 1989) (Thomas et al. 1990, cited in Beggs et al. 2005).At this time, wasp nest densities of 23 nests per hectare were recorded (Barlow et al. 2002),compared with only 8 nests per hectare in the 2 years of Beggs et al.’s (2005) study. In a laterstudy, Beggs et al. (2008) measured wasp densities across six sites over 19 years and found thatalthough wasp densities have varied between years, there is no evidence for a long-term declineor increase.We gathered varying opinions from apiarists, scientists and a wasp product exporter about thecurrent level of wasp populations in New Zealand. The wasp product exporter believed that therewere plenty of nests about and that wasp numbers were increasing again (Geoff Watts, pers.comm.). In addition, the Google trends tool showed that in January 2014 use of the term ‘wasp’was at its highest level in the Google dataset for New Zealand. Therefore, based on the findingsof Beggs (2001), Beggs et al. (2005) and Moller & Tilley (1989), more recent anecdotal evidence,and findings from the Google trends tool, we assumed that wasp numbers are currently at a lowerlevel than at their peak, but that <strong>wasps</strong> still exploit 50% of honeydew production in these upperSouth Island beech forests.It was also assumed that if <strong>wasps</strong> were removed, bees would harvest 25% of the 50% honeydewthat was no longer taken by <strong>wasps</strong> in the areas in which bees could forage, i.e. would harvest anoverall average of 12.5% of all available honeydew in the brown areas in Fig. 6). This means that14 An <strong>evaluation</strong> of the costs of <strong>pest</strong> <strong>wasps</strong> in New Zealand