- Page 1: REPORTIT N2014Living PlanetReport 2
- Page 4 and 5: Editor-In-Chief: Richard McLellan.L
- Page 6 and 7: FOREWORDMessage from WWF Internatio
- Page 8 and 9: WHAT’S ON THEHORIZON?~A park rang
- Page 10 and 11: INTRODUCTIONinternational agenda fo
- Page 12 and 13: Number of Planet Earths21World bioc
- Page 14 and 15: AT A GLANCEChapter 1: The state of
- Page 17 and 18: A LIVING PLANET~Only around 880 mou
- Page 19: Box 1: Explaining the use of LPI-D,
- Page 22 and 23: Threats to speciesThe main threats
- Page 24 and 25: Freshwater LPIThe freshwater index
- Page 26 and 27: Biogeographic realmsAll terrestrial
- Page 28 and 29: Protected areas and protecting spec
- Page 30 and 31: Africa has two species of rhino - b
- Page 32 and 33: HANDS ANDFOOTPRINTS~This worker in
- Page 34 and 35: The Ecological FootprintFor more th
- Page 36 and 37: Regional and national Ecological Fo
- Page 38 and 39: 12The size and composition of a nat
- Page 40 and 41: BiocapacityIn 2010, Earth’s bioca
- Page 42: Figure 25: Total biocapacity(in glo
- Page 45 and 46: © Brent Stirton / Reportage by Get
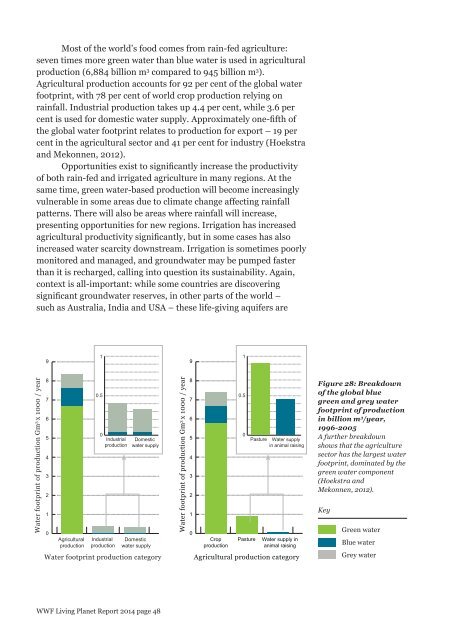
- Page 47 and 48: The water footprint has both tempor
- Page 49: 11109Figure 27: Waterfootprint of n
- Page 53 and 54: Figure 30: Mekonghydrograph: Waters
- Page 55 and 56: © Brent Stirton / Reportage for Ge
- Page 57 and 58: Box 2: Water scarcity in river basi
- Page 59 and 60: irrigation that have boosted the av
- Page 61 and 62: Ecological FootprintComparing the a
- Page 63 and 64: Figure 37: TheEcological Footprinti
- Page 65 and 66: © Brent Stirton / Reportage by Get
- Page 67 and 68: ut cohesively. They help communicat
- Page 69 and 70: Figure 38: Planetaryboundaries(Stoc
- Page 71 and 72: (a)Figure 40: Atmosphericconcentrat
- Page 73 and 74: Maximum speed at which species can
- Page 75 and 76: Figure 43: Personalnitrogen footpri
- Page 77 and 78: 21% - 100% 11% - 20% 9% - 10% 6% -
- Page 79 and 80: y 2030, as opposed to 2020, would m
- Page 81 and 82: species (10,000 km 2 5,000LanguageA
- Page 83 and 84: of species and changes the way the
- Page 85 and 86: Figure 53: Overallwater risk mapWat
- Page 87 and 88: © Brent Stirton / Reportage by Get
- Page 89 and 90: of our society, for us today and fo
- Page 91 and 92: RECREATIONWOODWATER SUPPLYNUTRIENTC
- Page 93 and 94: Food, water and energyconsumption r
- Page 95 and 96: The Mekong Riverconnects six countr
- Page 97 and 98: is increasing.management within the
- Page 99 and 100: City population1-5 million5-10 mill
- Page 101 and 102:
© Brent Stirton / Reportage by Get
- Page 103 and 104:
Figure 59: One PlanetPerspective(WW
- Page 105 and 106:
species of marine mammals and birds
- Page 107 and 108:
socially responsible way, both as e
- Page 109 and 110:
With fewer than a thousand mountain
- Page 111 and 112:
With mountain gorillas as the star
- Page 113 and 114:
The beauty and diversity of Belize
- Page 115 and 116:
ConservationInformedManagementDevel
- Page 117 and 118:
Water is one of South Africa’s sc
- Page 119 and 120:
Involving local people in the plant
- Page 121 and 122:
marine areas around the world.This
- Page 123 and 124:
Figure 66: A projectionstudy (B) ba
- Page 125 and 126:
An old Chinese proverb says: “Whe
- Page 127 and 128:
Figure 67: As ofDecember 2013,there
- Page 129 and 130:
“CAPE TOWN’SPARTICIPATION INTHE
- Page 131 and 132:
to create 10,000m 2 of new green ro
- Page 133 and 134:
© Brent Stirton / Reportage by Get
- Page 135 and 136:
economies that have raised standard
- Page 137 and 138:
© Brent Stirton / Reportage by Get
- Page 139 and 140:
C. Biogeographic realms (terrestria
- Page 141 and 142:
6. Why is the total number of speci
- Page 143 and 144:
Table 2: The proportionof species b
- Page 145 and 146:
12. How has the Living Planet Index
- Page 147 and 148:
1200010000Number of populations8000
- Page 150 and 151:
Ecological Footprint FAQ1. How is t
- Page 152 and 153:
5. How is international trade taken
- Page 154 and 155:
8. Does the Ecological Footprint ta
- Page 156 and 157:
For Ecological Footprint detailed m
- Page 158 and 159:
2010 Footprint composition(as perce
- Page 160 and 161:
2010 Footprint composition(as perce
- Page 162 and 163:
2010 Footprint composition(as perce
- Page 164 and 165:
3. Is there agreement on how to mea
- Page 166 and 167:
GLOSSARY OF TERMSAdaptationBiocapac
- Page 168 and 169:
Human DevelopmentIndex (HDI)Inequal
- Page 170 and 171:
REFERENCESBiological ConservationMo
- Page 172 and 173:
Economic contribution of the Great
- Page 174 and 175:
The World Database on Protected Are
- Page 176 and 177:
GlobalBiogeochemical CyclesChineseI
- Page 178 and 179:
WWF WORLDWIDE NETWORKWWF Associates
- Page 180:
LIVING PLANET REPORT 2014PLACESFrom