Listing all the minimum spanning trees in an undirected graph
Listing all the minimum spanning trees in an undirected graph
Listing all the minimum spanning trees in an undirected graph

Create successful ePaper yourself
Turn your PDF publications into a flip-book with our unique Google optimized e-Paper software.
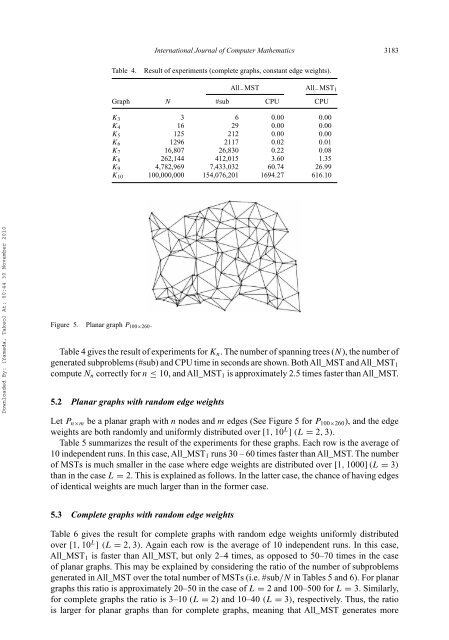
International Journal of Computer Ma<strong>the</strong>matics 3183Table 4.Result of experiments (complete <strong>graph</strong>s, const<strong>an</strong>t edge weights).All − MST All − MST 1Graph N #sub CPU CPUK 3 3 6 0.00 0.00K 4 16 29 0.00 0.00K 5 125 212 0.00 0.00K 6 1296 2117 0.02 0.01K 7 16,807 26,830 0.22 0.08K 8 262,144 412,015 3.60 1.35K 9 4,782,969 7,433,032 60.74 26.99K 10 100,000,000 154,076,201 1694.27 616.10Downloaded By: [Yamada, Takeo] At: 00:44 30 November 2010Figure 5. Pl<strong>an</strong>ar <strong>graph</strong> P 100×260 .Table 4 gives <strong>the</strong> result of experiments for K n . The number of <strong>sp<strong>an</strong>n<strong>in</strong>g</strong> <strong>trees</strong> (N), <strong>the</strong> number ofgenerated subproblems (#sub) <strong>an</strong>d CPU time <strong>in</strong> seconds are shown. BothAll_MST <strong>an</strong>dAll_MST 1compute N n correctly for n ≤ 10, <strong>an</strong>d All_MST 1 is approximately 2.5 times faster th<strong>an</strong> All_MST.5.2 Pl<strong>an</strong>ar <strong>graph</strong>s with r<strong>an</strong>dom edge weightsLet P n×m be a pl<strong>an</strong>ar <strong>graph</strong> with n nodes <strong>an</strong>d m edges (See Figure 5 for P 100×260 ), <strong>an</strong>d <strong>the</strong> edgeweights are both r<strong>an</strong>domly <strong>an</strong>d uniformly distributed over [1, 10 L ] (L = 2, 3).Table 5 summarizes <strong>the</strong> result of <strong>the</strong> experiments for <strong>the</strong>se <strong>graph</strong>s. Each row is <strong>the</strong> average of10 <strong>in</strong>dependent runs. In this case, All_MST 1 runs 30 – 60 times faster th<strong>an</strong> All_MST. The numberof MSTs is much sm<strong>all</strong>er <strong>in</strong> <strong>the</strong> case where edge weights are distributed over [1, 1000] (L = 3)th<strong>an</strong> <strong>in</strong> <strong>the</strong> case L = 2. This is expla<strong>in</strong>ed as follows. In <strong>the</strong> latter case, <strong>the</strong> ch<strong>an</strong>ce of hav<strong>in</strong>g edgesof identical weights are much larger th<strong>an</strong> <strong>in</strong> <strong>the</strong> former case.5.3 Complete <strong>graph</strong>s with r<strong>an</strong>dom edge weightsTable 6 gives <strong>the</strong> result for complete <strong>graph</strong>s with r<strong>an</strong>dom edge weights uniformly distributedover [1, 10 L ] (L = 2, 3). Aga<strong>in</strong> each row is <strong>the</strong> average of 10 <strong>in</strong>dependent runs. In this case,All_MST 1 is faster th<strong>an</strong> All_MST, but only 2–4 times, as opposed to 50–70 times <strong>in</strong> <strong>the</strong> caseof pl<strong>an</strong>ar <strong>graph</strong>s. This may be expla<strong>in</strong>ed by consider<strong>in</strong>g <strong>the</strong> ratio of <strong>the</strong> number of subproblemsgenerated <strong>in</strong> All_MST over <strong>the</strong> total number of MSTs (i.e. #sub/N <strong>in</strong> Tables 5 <strong>an</strong>d 6). For pl<strong>an</strong>ar<strong>graph</strong>s this ratio is approximately 20–50 <strong>in</strong> <strong>the</strong> case of L = 2 <strong>an</strong>d 100–500 for L = 3. Similarly,for complete <strong>graph</strong>s <strong>the</strong> ratio is 3–10 (L = 2) <strong>an</strong>d 10–40 (L = 3), respectively. Thus, <strong>the</strong> ratiois larger for pl<strong>an</strong>ar <strong>graph</strong>s th<strong>an</strong> for complete <strong>graph</strong>s, me<strong>an</strong><strong>in</strong>g that All_MST generates more