PROJECTED BALANCE SHEET thousand NCU TOTAL ASSETS Total current assets Inventory on materials & supplies Work in progress Finished product Accounts receivable Cash-in-hand Short-term deposits Cash surplus, finance available Total fixed assets, net of depreciation Fixed investments Construction in progress Total pre-production expenditures Less accumulated depreciation Less depreciation allowance Accumulated losses brought forward Loss in current year TOTAL LIABILITIES Total current liabilities Accounts payable Total short-term debt Total long-term debt Total equity capital Ordinary capital Preference capital Subsidies, grants Reserves, retained profit brought forward Retained profit Net worth Ratios (%) <strong>COMFAR</strong> <strong>III</strong> Expert <strong>COMFAR</strong> GROUP, UNIDO Equity to total liabilities Net worth to total liabilities Long-term debt to net worth Current assets to current liabilities 1991 1992 1993 1994 1995 1996 1997 1998 3,348.80 9,205.10 10,284.06 9,682.23 9,107.86 9,363.10 8,942.05 8,552.87 29.00 882.00 2,284.27 2,337.75 2,750.69 3,661.24 3,895.50 3,161.63 0.00 390.00 586.99 740.58 857.78 919.15 916.67 916.67 0.00 0.00 134.06 165.83 190.02 202.97 202.50 202.50 0.00 0.00 363.04 297.86 336.16 358.33 358.33 358.33 0.00 0.00 499.50 625.93 704.40 750.00 750.00 750.00 0.00 0.00 115.03 128.38 138.43 143.92 143.75 143.75 0.00 0.00 0.00 0.00 0.00 0.00 0.00 0.00 29.00 492.00 585.64 379.18 523.91 1,286.87 1,524.25 790.38 3,319.80 8,323.10 7,667.79 7,012.48 6,357.17 5,701.86 5,046.55 5,391.24 0.00 3,000.00 7,710.00 7,710.00 7,710.00 7,710.00 7,710.00 7,710.00 3,000.00 4,710.00 0.00 0.00 0.00 0.00 0.00 1,000.00 319.80 613.10 613.10 613.10 613.10 613.10 613.10 613.10 0.00 0.00 655.31 1,310.62 1,965.93 2,621.24 3,276.55 3,931.86 0.00 0.00 0.00 0.00 0.00 0.00 0.00 0.00 0.00 0.00 0.00 332.00 0.00 0.00 0.00 0.00 0.00 0.00 332.00 0.00 0.00 0.00 0.00 0.00 3,348.80 9,205.10 10,284.06 9,682.23 9,107.86 9,363.10 8,942.05 8,552.87 0.00 0.00 1,078.95 506.10 358.46 378.34 374.90 375.00 0.00 0.00 278.95 306.10 358.46 378.34 374.90 375.00 0.00 0.00 800.00 200.00 0.00 0.00 0.00 0.00 748.80 5,705.10 5,705.10 5,152.08 4,011.06 2,870.04 1,729.02 588.00 2,600.00 3,500.00 3,500.00 3,500.00 3,500.00 3,500.00 3,500.00 3,500.00 0.00 0.00 0.00 0.00 0.00 0.00 0.00 0.00 2,600.00 3,500.00 3,500.00 3,500.00 3,500.00 3,500.00 3,500.00 3,500.00 0.00 0.00 0.00 0.00 0.00 0.00 0.00 0.00 0.00 0.00 0.00 0.00 192.05 1,238.33 2,614.72 3,338.13 0.00 0.00 0.00 524.05 1,046.28 1,376.39 723.41 751.74 2,600.00 3,500.00 3,168.00 3,692.05 4,738.33 6,114.72 6,838.13 7,589.87 77.64 38.02 34.03 36.15 38.43 37.38 39.14 40.92 77.64 38.02 30.80 38.13 52.02 65.31 76.47 88.74 0.29 1.63 1.80 1.40 0.85 0.47 0.25 0.08 0.00 0.00 2.12 4.62 7.67 9.68 10.39 8.43 8
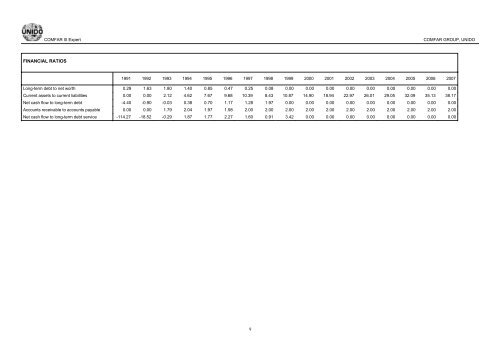
<strong>COMFAR</strong> <strong>III</strong> Expert <strong>COMFAR</strong> GROUP, UNIDO FINANCIAL RATIOS Long-term debt to net worth Current assets to current liabilities Net cash flow to long-term debt Accounts receivable to accounts payable Net cash flow to long-term debt service 1991 1992 1993 1994 1995 1996 1997 1998 1999 2000 2001 2002 2003 2004 2005 2006 2007 0.29 1.63 1.80 1.40 0.85 0.47 0.25 0.08 0.00 0.00 0.00 0.00 0.00 0.00 0.00 0.00 0.00 0.00 0.00 2.12 4.62 7.67 9.68 10.39 8.43 10.87 14.90 18.94 22.97 26.01 29.05 32.09 35.13 38.17 -4.40 -0.90 -0.03 0.38 0.70 1.17 1.28 1.97 0.00 0.00 0.00 0.00 0.00 0.00 0.00 0.00 0.00 0.00 0.00 1.79 2.04 1.97 1.98 2.00 2.00 2.00 2.00 2.00 2.00 2.00 2.00 2.00 2.00 2.00 -114.27 -18.52 -0.29 1.87 1.77 2.27 1.60 0.91 3.42 0.00 0.00 0.00 0.00 0.00 0.00 0.00 0.00 9