

NPI2013_Asia-Pacific
NPI2013_Asia-Pacific
NPI2013_Asia-Pacific

You also want an ePaper? Increase the reach of your titles
YUMPU automatically turns print PDFs into web optimized ePapers that Google loves.
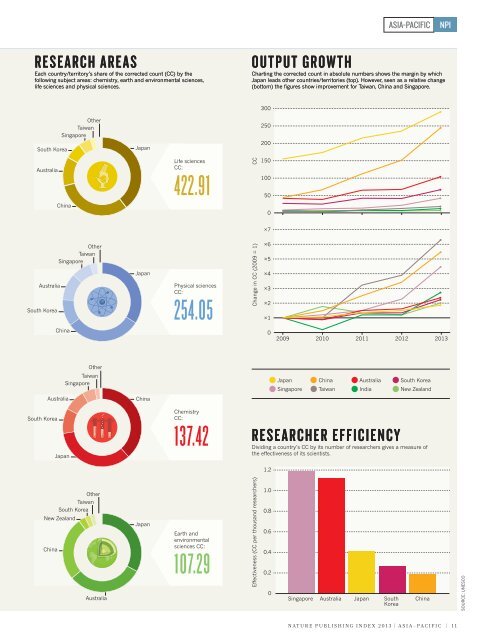
ASIA-PACIFICNPIRESEARCH AREASEach country/territory’s share of the corrected count (CC) by thefollowing subject areas: chemistry, earth and environmental sciences,life sciences and physical sciences.OUTPUT GROWTHCharting the corrected count in absolute numbers shows the margin by whichJapan leads other countries/territories (top). However, seen as a relative change(bottom) the figures show improvement for Taiwan, China and Singapore.OtherTaiwanSingaporeSouth KoreaJapan300250200AustraliaChinaLife sciencesCC:422.91CC150100500×7OtherTaiwanSingaporeAustraliaSouth KoreaJapanPhysical sciencesCC:254.05Change in CC (2009 = 1)×6×5×4×3×2×1China02009 2010 2011 2012 2013OtherTaiwanSingaporeJapanSingaporeChinaTaiwanAustraliaIndiaSouth KoreaNew ZealandAustraliaChinaSouth KoreaJapanChemistryCC:137.42RESEARCHER EFFICIENCYDividing a country’s CC by its number of researchers gives a measure ofthe effectiveness of its scientists.1.2OtherTaiwanSouth KoreaNew ZealandChinaAustraliaJapanEarth andenvironmentalsciences CC:107.29Effectiveness (CC per thousand researchers)1.00.80.60.40.20SingaporeAustraliaJapanSouthKoreaChinaSOURCE: UNESCONATURE PUBLISHING INDEX 2013 | ASIA-PACIFIC | 11