Semi Annual Report - DWS Investments
Semi Annual Report - DWS Investments
Semi Annual Report - DWS Investments

You also want an ePaper? Increase the reach of your titles
YUMPU automatically turns print PDFs into web optimized ePapers that Google loves.
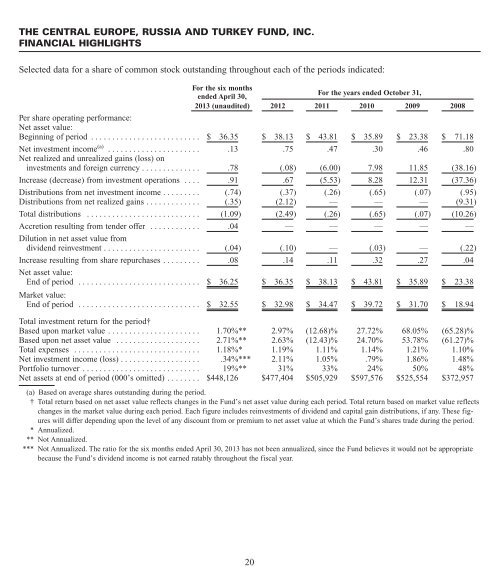
THE CENTRAL EUROPE, RUSSIA AND TURKEY FUND, INC.FINANCIAL HIGHLIGHTSSelected data for a share of common stock outstanding throughout each of the periods indicated:For the six monthsended April 30,For the years ended October 31,2013 (unaudited) 2012 2011 2010 2009 2008Per share operating performance:Net asset value:Beginning of period . . . . . . . . . . . . . . . . . . . . . . . . . . $ 36.35 $ 38.13 $ 43.81 $ 35.89 $ 23.38 $ 71.18Net investment income (a) . . . . . . . . . . . . . . . . . . . . . . .13 .75 .47 .30 .46 .80Net realized and unrealized gains (loss) oninvestments and foreign currency . . . . . . . . . . . . . . .78 (.08) (6.00) 7.98 11.85 (38.16)Increase (decrease) from investment operations . . . . .91 .67 (5.53) 8.28 12.31 (37.36)Distributions from net investment income . . . . . . . . . (.74) (.37) (.26) (.65) (.07) (.95)Distributions from net realized gains . . . . . . . . . . . . . (.35) (2.12) — — — (9.31)Total distributions . . . . . . . . . . . . . . . . . . . . . . . . . . . (1.09) (2.49) (.26) (.65) (.07) (10.26)Accretion resulting from tender offer . . . . . . . . . . . . .04 — — — — —Dilution in net asset value fromdividend reinvestment . . . . . . . . . . . . . . . . . . . . . . . (.04) (.10) — (.03) — (.22)Increase resulting from share repurchases . . . . . . . . . .08 .14 .11 .32 .27 .04Net asset value:End of period . . . . . . . . . . . . . . . . . . . . . . . . . . . . . $ 36.25 $ 36.35 $ 38.13 $ 43.81 $ 35.89 $ 23.38Market value:End of period . . . . . . . . . . . . . . . . . . . . . . . . . . . . . $ 32.55 $ 32.98 $ 34.47 $ 39.72 $ 31.70 $ 18.94Total investment return for the period†Based upon market value . . . . . . . . . . . . . . . . . . . . . . 1.70%** 2.97% (12.68)% 27.72% 68.05% (65.28)%Based upon net asset value . . . . . . . . . . . . . . . . . . . . 2.71%** 2.63% (12.43)% 24.70% 53.78% (61.27)%Total expenses . . . . . . . . . . . . . . . . . . . . . . . . . . . . . . 1.18%* 1.19% 1.11% 1.14% 1.21% 1.10%Net investment income (loss) . . . . . . . . . . . . . . . . . . . .34%*** 2.11% 1.05% .79% 1.86% 1.48%Portfolio turnover . . . . . . . . . . . . . . . . . . . . . . . . . . . . 19%** 31% 33% 24% 50% 48%Net assets at end of period (000’s omitted) . . . . . . . . $448,126 $477,404 $505,929 $597,576 $525,554 $372,957(a) Based on average shares outstanding during the period.† Total return based on net asset value reflects changes in the Fund’s net asset value during each period. Total return based on market value reflectschanges in the market value during each period. Each figure includes reinvestments of dividend and capital gain distributions, if any. These figureswill differ depending upon the level of any discount from or premium to net asset value at which the Fund’s shares trade during the period.* <strong>Annual</strong>ized.** Not <strong>Annual</strong>ized.*** Not <strong>Annual</strong>ized. The ratio for the six months ended April 30, 2013 has not been annualized, since the Fund believes it would not be appropriatebecause the Fund’s dividend income is not earned ratably throughout the fiscal year.20