Dairy's Bottom Line - Professional Dairy Producers of Wisconsin
Dairy's Bottom Line - Professional Dairy Producers of Wisconsin
Dairy's Bottom Line - Professional Dairy Producers of Wisconsin
Create successful ePaper yourself
Turn your PDF publications into a flip-book with our unique Google optimized e-Paper software.
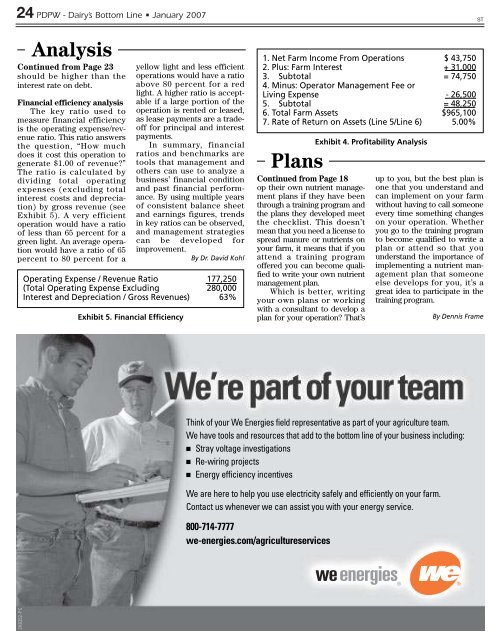
24 PDPW - <strong>Dairy</strong>’s <strong>Bottom</strong> <strong>Line</strong> • January 2007STAnalysisContinued from Page 23should be higher than theinterest rate on debt.Financial efficiency analysisThe key ratio used tomeasure financial efficiencyis the operating expense/revenueratio. This ratio answersthe question, “How muchdoes it cost this operation togenerate $1.00 <strong>of</strong> revenue?”The ratio is calculated bydividing total operatingexpenses (excluding totalinterest costs and depreciation)by gross revenue (seeExhibit 5). A very efficientoperation would have a ratio<strong>of</strong> less than 65 percent for agreen light. An average operationwould have a ratio <strong>of</strong> 65percent to 80 percent for ayellow light and less efficientoperations would have a ratioabove 80 percent for a redlight. A higher ratio is acceptableif a large portion <strong>of</strong> theoperation is rented or leased,as lease payments are a trade<strong>of</strong>ffor principal and interestpayments.In summary, financialratios and benchmarks aretools that management andothers can use to analyze abusiness’ financial conditionand past financial performance.By using multiple years<strong>of</strong> consistent balance sheetand earnings figures, trendsin key ratios can be observed,and management strategiescan be developed forimprovement.By Dr. David KohlOperating Expense / Revenue Ratio 177,250(Total Operating Expense Excluding 280,000Interest and Depreciation / Gross Revenues) 63%Exhibit 5. Financial Efficiency1. Net Farm Income From Operations $ 43,7502. Plus: Farm Interest + 31,0003. Subtotal = 74,7504. Minus: Operator Management Fee orLiving Expense - 26,5005. Subtotal = 48,2506. Total Farm Assets $965,1007. Rate <strong>of</strong> Return on Assets (<strong>Line</strong> 5/<strong>Line</strong> 6) 5.00%PlansContinued from Page 18op their own nutrient managementplans if they have beenthrough a training program andthe plans they developed meetthe checklist. This doesn’tmean that you need a license tospread manure or nutrients onyour farm, it means that if youattend a training program<strong>of</strong>fered you can become qualifiedto write your own nutrientmanagement plan.Which is better, writingyour own plans or workingwith a consultant to develop aplan for your operation? That’sExhibit 4. Pr<strong>of</strong>itability Analysisup to you, but the best plan isone that you understand andcan implement on your farmwithout having to call someoneevery time something changeson your operation. Whetheryou go to the training programto become qualified to write aplan or attend so that youunderstand the importance <strong>of</strong>implementing a nutrient managementplan that someoneelse develops for you, it’s agreat idea to participate in thetraining program.By Dennis FrameThink <strong>of</strong> your We Energies field representative as part <strong>of</strong> your agriculture team.We have tools and resources that add to the bottom line <strong>of</strong> your business including:■ Stray voltage investigations■ Re-wiring projects■ Energy efficiency incentivesWe are here to help you use electricity safely and efficiently on your farm.Contact us whenever we can assist you with your energy service.800-714-7777we-energies.com/agricultureservices2K6352-PC


