

Detection of rice sheath blight for in-season disease management ...
Detection of rice sheath blight for in-season disease management ...
Detection of rice sheath blight for in-season disease management ...
- No tags were found...

You also want an ePaper? Increase the reach of your titles
YUMPU automatically turns print PDFs into web optimized ePapers that Google loves.
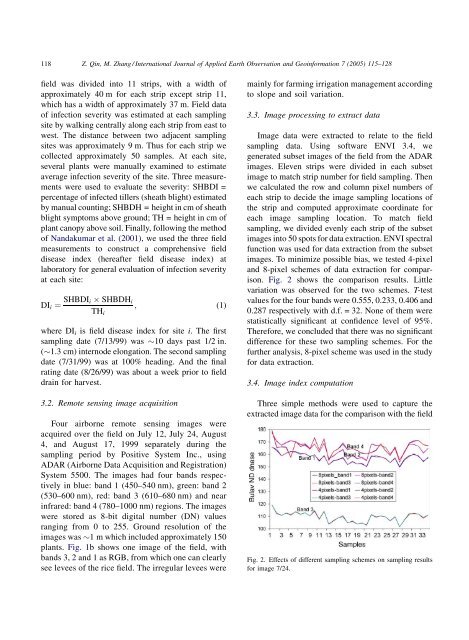
118Z. Q<strong>in</strong>, M. Zhang / International Journal <strong>of</strong> Applied Earth Observation and Geo<strong>in</strong><strong>for</strong>mation 7 (2005) 115–128field was divided <strong>in</strong>to 11 strips, with a width <strong>of</strong>approximately 40 m <strong>for</strong> each strip except strip 11,which has a width <strong>of</strong> approximately 37 m. Field data<strong>of</strong> <strong>in</strong>fection severity was estimated at each sampl<strong>in</strong>gsite by walk<strong>in</strong>g centrally along each strip from east towest. The distance between two adjacent sampl<strong>in</strong>gsites was approximately 9 m. Thus <strong>for</strong> each strip wecollected approximately 50 samples. At each site,several plants were manually exam<strong>in</strong>ed to estimateaverage <strong>in</strong>fection severity <strong>of</strong> the site. Three measurementswere used to evaluate the severity: SHBDI =percentage <strong>of</strong> <strong>in</strong>fected tillers (<strong>sheath</strong> <strong>blight</strong>) estimatedby manual count<strong>in</strong>g; SHBDH = height <strong>in</strong> cm <strong>of</strong> <strong>sheath</strong><strong>blight</strong> symptoms above ground; TH = height <strong>in</strong> cm <strong>of</strong>plant canopy above soil. F<strong>in</strong>ally, follow<strong>in</strong>g the method<strong>of</strong> Nandakumar et al. (2001), we used the three fieldmeasurements to construct a comprehensive field<strong>disease</strong> <strong>in</strong>dex (hereafter field <strong>disease</strong> <strong>in</strong>dex) atlaboratory <strong>for</strong> general evaluation <strong>of</strong> <strong>in</strong>fection severityat each site:DI i ¼ SHBDI i SHBDH iTH i; (1)where DI i is field <strong>disease</strong> <strong>in</strong>dex <strong>for</strong> site i. The firstsampl<strong>in</strong>g date (7/13/99) was 10 days past 1/2 <strong>in</strong>.(1.3 cm) <strong>in</strong>ternode elongation. The second sampl<strong>in</strong>gdate (7/31/99) was at 100% head<strong>in</strong>g. And the f<strong>in</strong>alrat<strong>in</strong>g date (8/26/99) was about a week prior to fielddra<strong>in</strong> <strong>for</strong> harvest.3.2. Remote sens<strong>in</strong>g image acquisitionFour airborne remote sens<strong>in</strong>g images wereacquired over the field on July 12, July 24, August4, and August 17, 1999 separately dur<strong>in</strong>g thesampl<strong>in</strong>g period by Positive System Inc., us<strong>in</strong>gADAR (Airborne Data Acquisition and Registration)System 5500. The images had four bands respectively<strong>in</strong> blue: band 1 (450–540 nm), green: band 2(530–600 nm), red: band 3 (610–680 nm) and near<strong>in</strong>frared: band 4 (780–1000 nm) regions. The imageswere stored as 8-bit digital number (DN) valuesrang<strong>in</strong>g from 0 to 255. Ground resolution <strong>of</strong> theimages was 1 m which <strong>in</strong>cluded approximately 150plants. Fig. 1b shows one image <strong>of</strong> the field, withbands 3, 2 and 1 as RGB, from which one can clearlysee levees <strong>of</strong> the <strong>rice</strong> field. The irregular levees werema<strong>in</strong>ly <strong>for</strong> farm<strong>in</strong>g irrigation <strong>management</strong> accord<strong>in</strong>gto slope and soil variation.3.3. Image process<strong>in</strong>g to extract dataImage data were extracted to relate to the fieldsampl<strong>in</strong>g data. Us<strong>in</strong>g s<strong>of</strong>tware ENVI 3.4, wegenerated subset images <strong>of</strong> the field from the ADARimages. Eleven strips were divided <strong>in</strong> each subsetimage to match strip number <strong>for</strong> field sampl<strong>in</strong>g. Thenwe calculated the row and column pixel numbers <strong>of</strong>each strip to decide the image sampl<strong>in</strong>g locations <strong>of</strong>the strip and computed approximate coord<strong>in</strong>ate <strong>for</strong>each image sampl<strong>in</strong>g location. To match fieldsampl<strong>in</strong>g, we divided evenly each strip <strong>of</strong> the subsetimages <strong>in</strong>to 50 spots <strong>for</strong> data extraction. ENVI spectralfunction was used <strong>for</strong> data extraction from the subsetimages. To m<strong>in</strong>imize possible bias, we tested 4-pixeland 8-pixel schemes <strong>of</strong> data extraction <strong>for</strong> comparison.Fig. 2 shows the comparison results. Littlevariation was observed <strong>for</strong> the two schemes. T-testvalues <strong>for</strong> the four bands were 0.555, 0.233, 0.406 and0.287 respectively with d.f. = 32. None <strong>of</strong> them werestatistically significant at confidence level <strong>of</strong> 95%.There<strong>for</strong>e, we concluded that there was no significantdifference <strong>for</strong> these two sampl<strong>in</strong>g schemes. For thefurther analysis, 8-pixel scheme was used <strong>in</strong> the study<strong>for</strong> data extraction.3.4. Image <strong>in</strong>dex computationThree simple methods were used to capture theextracted image data <strong>for</strong> the comparison with the fieldFig. 2. Effects <strong>of</strong> different sampl<strong>in</strong>g schemes on sampl<strong>in</strong>g results<strong>for</strong> image 7/24.