statistical handbook 2008 - 2010 - Department of Examinations - Sri ...
statistical handbook 2008 - 2010 - Department of Examinations - Sri ...
statistical handbook 2008 - 2010 - Department of Examinations - Sri ...
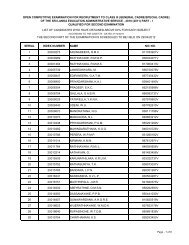
- No tags were found...

Create successful ePaper yourself
Turn your PDF publications into a flip-book with our unique Google optimized e-Paper software.
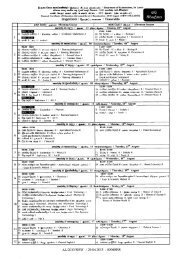
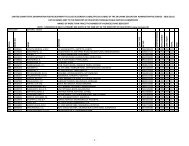
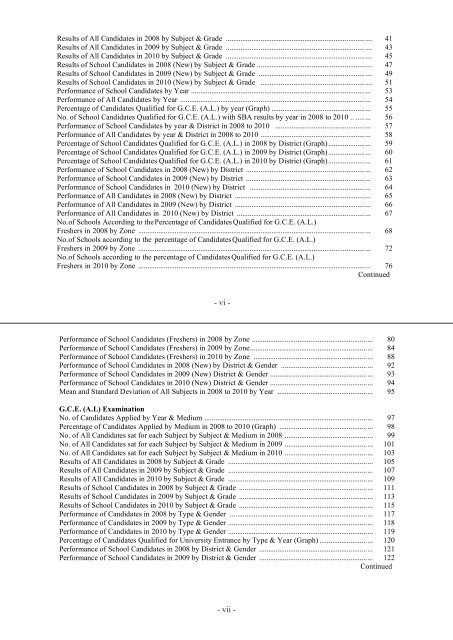
Results <strong>of</strong> All Candidates in <strong>2008</strong> by Subject & Grade ................................................................................ 41Results <strong>of</strong> All Candidates in 2009 by Subject & Grade ................................................................................ 43Results <strong>of</strong> All Candidates in <strong>2010</strong> by Subject & Grade ................................................................................ 45Results <strong>of</strong> School Candidates in <strong>2008</strong> (New) by Subject & Grade ............................................................... 47Results <strong>of</strong> School Candidates in 2009 (New) by Subject & Grade .............................................................. 49Results <strong>of</strong> School Candidates in <strong>2010</strong> (New) by Subject & Grade ............................................................. 51Performance <strong>of</strong> School Candidates by Year .................................................................................................. 53Performance <strong>of</strong> All Candidates by Year ........................................................................................................ 54Percentage <strong>of</strong> Candidates Qualified for G.C.E. (A.L.) by year (Graph) ...................................................... 55No. <strong>of</strong> School Candidates Qualified for G.C.E. (A.L.) with SBA results by year in <strong>2008</strong> to <strong>2010</strong> .. ........ 56Performance <strong>of</strong> School Candidates by year & District in <strong>2008</strong> to <strong>2010</strong> .................................................... 57Performance <strong>of</strong> All Candidates by year & District in <strong>2008</strong> to <strong>2010</strong> ............................................................ 58Percentage <strong>of</strong> School Candidates Qualified for G.C.E. (A.L.) in <strong>2008</strong> by District (Graph)....................... 59Percentage <strong>of</strong> School Candidates Qualified for G.C.E. (A.L.) in 2009 by District (Graph)....................... 60Percentage <strong>of</strong> School Candidates Qualified for G.C.E. (A.L.) in <strong>2010</strong> by District (Graph)....................... 61Performance <strong>of</strong> School Candidates in <strong>2008</strong> (New) by District .................................................................... 62Performance <strong>of</strong> School Candidates in 2009 (New) by District .................................................................... 63Performance <strong>of</strong> School Candidates in <strong>2010</strong> (New) by District .................................................................. 64Performance <strong>of</strong> All Candidates in <strong>2008</strong> (New) by District .......................................................................... 65Performance <strong>of</strong> All Candidates in 2009 (New) by District .......................................................................... 66Performance <strong>of</strong> All Candidates in <strong>2010</strong> (New) by District ......................................................................... 67No. <strong>of</strong> Schools According to the Percentage <strong>of</strong> Candidates Qualified for G.C.E. (A.L.)Freshers in <strong>2008</strong> by Zone ............................................................................................................................... 68No. <strong>of</strong> Schools according to the percentage <strong>of</strong> Candidates Qualified for G.C.E. (A.L.)Freshers in 2009 by Zone ............................................................................................................................... 72No. <strong>of</strong> Schools according to the percentage <strong>of</strong> Candidates Qualified for G.C.E. (A.L.)Freshers in <strong>2010</strong> by Zone ............................................................................................................................... 76Continued- vi vi -Performance <strong>of</strong> School Candidates (Freshers) in <strong>2008</strong> by Zone .................................................................. 80Performance <strong>of</strong> School Candidates (Freshers) in 2009 by Zone................................................................... 84Performance <strong>of</strong> School Candidates (Freshers) in <strong>2010</strong> by Zone ................................................................. 88Performance <strong>of</strong> School Candidates in <strong>2008</strong> (New) by District & Gender .................................................. 92Performance <strong>of</strong> School Candidates in 2009 (New) District & Gender ........................................................ 93Performance <strong>of</strong> School Candidates in <strong>2010</strong> (New) District & Gender ........................................................ 94Mean and Standard Deviation <strong>of</strong> All Subjects in <strong>2008</strong> to <strong>2010</strong> by Year .................................................... 95G.C.E. (A.L) ExaminationNo. <strong>of</strong> Candidates Applied by Year & Medium ............................................................................................ 97Percentage <strong>of</strong> Candidates Applied by Medium in <strong>2008</strong> to <strong>2010</strong> (Graph) ................................................... 98No. <strong>of</strong> All Candidates sat for each Subject by Subject & Medium in <strong>2008</strong> ................................................ 99No. <strong>of</strong> All Candidates sat for each Subject by Subject & Medium in 2009 ................................................ 101No. <strong>of</strong> All Candidates sat for each Subject by Subject & Medium in <strong>2010</strong> ................................................ 103Results <strong>of</strong> All Candidates in <strong>2008</strong> by Subject & Grade ............................................................................... 105Results <strong>of</strong> All Candidates in 2009 by Subject & Grade ............................................................................... 107Results <strong>of</strong> All Candidates in <strong>2010</strong> by Subject & Grade ............................................................................... 109Results <strong>of</strong> School Candidates in <strong>2008</strong> by Subject & Grade ......................................................................... 111Results <strong>of</strong> School Candidates in 2009 by Subject & Grade ......................................................................... 113Results <strong>of</strong> School Candidates in <strong>2010</strong> by Subject & Grade ......................................................................... 115Performance <strong>of</strong> Candidates in <strong>2008</strong> by Type & Gender .............................................................................. 117Performance <strong>of</strong> Candidates in 2009 by Type & Gender ............................................................................... 118Performance <strong>of</strong> Candidates in <strong>2010</strong> by Type & Gender ............................................................................... 119Percentage <strong>of</strong> Candidates Qualified for University Entrance by Type & Year (Graph) ............................. 120Performance <strong>of</strong> School Candidates in <strong>2008</strong> by District & Gender .............................................................. 121Performance <strong>of</strong> School Candidates in 2009 by District & Gender .............................................................. 122Continuedvii- vii -