Spatial Input-Output Models: PECAS - WebHome - UrbanSim
Spatial Input-Output Models: PECAS - WebHome - UrbanSim
Spatial Input-Output Models: PECAS - WebHome - UrbanSim
- No tags were found...

You also want an ePaper? Increase the reach of your titles
YUMPU automatically turns print PDFs into web optimized ePapers that Google loves.
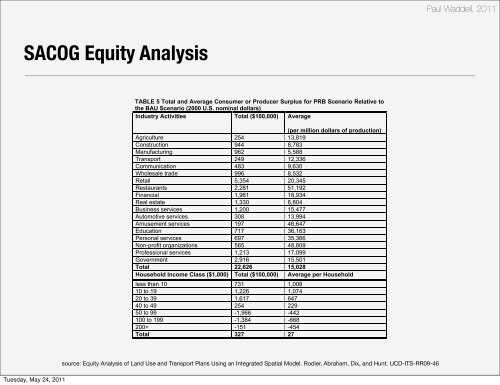
Paul Waddell, 2011SACOG Equity AnalysisTABLE 5 Total and Average Consumer or Producer Surplus for PRB Scenario Relative tothe BAU Scenario (2000 U.S. nominal dollars)Industry Activities Total ($100,000) Average(per million dollars of production)Agriculture 254 13,819Construction 944 8,783Manufacturing 962 5,588Transport 249 12,336Communication 483 9,630Wholesale trade 996 8,532Retail 5,354 20,345Restaurants 2,281 51,192Financial 1,961 18,934Real estate 1,330 6,804Business services 1,200 15,477Automotive services 308 13,994Amusement services 197 46,647Education 717 36,163Personal services 697 35,366Non-profit organizations 565 48,809Professional services 1,213 17,099Government 2,916 15,501Total 22,626 15,028Household Income Class ($1,000) Total ($100,000) Average per Householdless than 10 731 1,00810 to 19 1,226 1,07420 to 39 1,617 64740 to 49 254 22950 to 99 -1,966 -442100 to 199 -1,384 -668200+ -151 -454Total 327 27source: Equity Analysis of Land Use and Transport Plans Using an Integrated <strong>Spatial</strong> Model. Rodier, Abraham, Dix, and Hunt. UCD-ITS-RR09-46Tuesday, May 24, 2011