

Columbia ETF Trust - Columbia Management
Columbia ETF Trust - Columbia Management
Columbia ETF Trust - Columbia Management

Create successful ePaper yourself
Turn your PDF publications into a flip-book with our unique Google optimized e-Paper software.
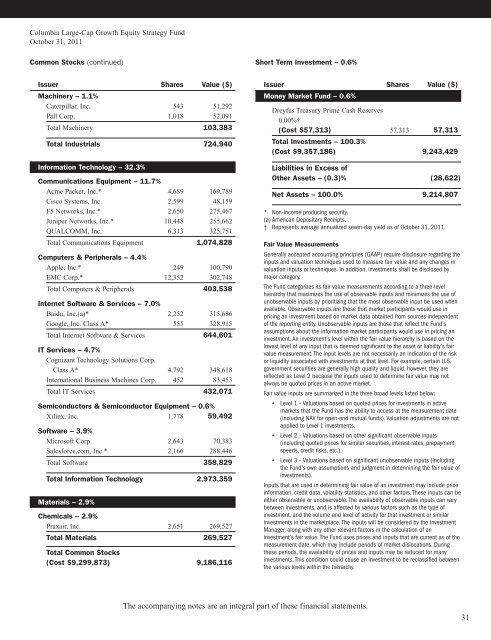
<strong>Columbia</strong> Large-Cap Growth Equity Strategy Fund<br />
October 31, 2011<br />
Common Stocks (continued) Short Term Investment – 0.6%<br />
Issuer Shares Value ($)<br />
Machinery – 1.1%<br />
Caterpillar, Inc. 543 51,292<br />
Pall Corp. 1,018 52,091<br />
Total Machinery 103,383<br />
Total Industrials 724,940<br />
Information Technology – 32.3%<br />
Communications Equipment – 11.7%<br />
Acme Packet, Inc.* 4,689 169,789<br />
Cisco Systems, Inc. 2,599 48,159<br />
F5 Networks, Inc.* 2,650 275,467<br />
Juniper Networks, Inc.* 10,448 255,662<br />
QUALCOMM, Inc. 6,313 325,751<br />
Total Communications Equipment 1,074,828<br />
Computers & Peripherals – 4.4%<br />
Apple, Inc.* 249 100,790<br />
EMC Corp.* 12,352 302,748<br />
Total Computers & Peripherals 403,538<br />
Internet Software & Services – 7.0%<br />
Baidu, Inc.(a)* 2,252 315,686<br />
Google, Inc. Class A* 555 328,915<br />
Total Internet Software & Services 644,601<br />
IT Services – 4.7%<br />
Cognizant Technology Solutions Corp.<br />
Class A* 4,792 348,618<br />
International Business Machines Corp. 452 83,453<br />
Total IT Services 432,071<br />
Semiconductors & Semiconductor Equipment – 0.6%<br />
Xilinx, Inc. 1,778 59,492<br />
Software – 3.9%<br />
Microsoft Corp. 2,643 70,383<br />
Salesforce.com, Inc.* 2,166 288,446<br />
Total Software 358,829<br />
Total Information Technology 2,973,359<br />
Materials – 2.9%<br />
Chemicals – 2.9%<br />
Praxair, Inc. 2,651 269,527<br />
Total Materials 269,527<br />
Total Common Stocks<br />
(Cost $9,299,873) 9,186,116<br />
Issuer Shares Value ($)<br />
Money Market Fund – 0.6%<br />
Dreyfus Treasury Prime Cash Reserves<br />
0.00%†<br />
(Cost $57,313) 57,313 57,313<br />
Total Investments – 100.3%<br />
(Cost $9,357,186) 9,243,429<br />
Liabilities in Excess of<br />
Other Assets – (0.3)% (28,622)<br />
Net Assets – 100.0% 9,214,807<br />
* Non-income producing security.<br />
(a) American Depositary Receipts.<br />
† Represents average annualized seven-day yield as of October 31, 2011.<br />
Fair Value Measurements<br />
Generally accepted accounting principles (GAAP) require disclosure regarding the<br />
inputs and valuation techniques used to measure fair value and any changes in<br />
valuation inputs or techniques. In addition, investments shall be disclosed by<br />
major category.<br />
The Fund categorizes its fair value measurements according to a three-level<br />
hierarchy that maximizes the use of observable inputs and minimizes the use of<br />
unobservable inputs by prioritizing that the most observable input be used when<br />
available. Observable inputs are those that market participants would use in<br />
pricing an investment based on market data obtained from sources independent<br />
of the reporting entity. Unobservable inputs are those that reflect the Fund’s<br />
assumptions about the information market participants would use in pricing an<br />
investment. An investment’s level within the fair value hierarchy is based on the<br />
lowest level of any input that is deemed significant to the asset or liability’s fair<br />
value measurement. The input levels are not necessarily an indication of the risk<br />
or liquidity associated with investments at that level. For example, certain U.S.<br />
government securities are generally high quality and liquid, however, they are<br />
reflected as Level 2 because the inputs used to determine fair value may not<br />
always be quoted prices in an active market.<br />
Fair value inputs are summarized in the three broad levels listed below:<br />
Level 1 – Valuations based on quoted prices for investments in active<br />
markets that the Fund has the ability to access at the measurement date<br />
(including NAV for open-end mutual funds). Valuation adjustments are not<br />
applied to Level 1 investments.<br />
Level 2 – Valuations based on other significant observable inputs<br />
(including quoted prices for similar securities, interest rates, prepayment<br />
speeds, credit risks, etc.).<br />
Level 3 – Valuations based on significant unobservable inputs (including<br />
the Fund’s own assumptions and judgment in determining the fair value of<br />
investments).<br />
Inputs that are used in determining fair value of an investment may include price<br />
information, credit data, volatility statistics, and other factors. These inputs can be<br />
either observable or unobservable. The availability of observable inputs can vary<br />
between investments, and is affected by various factors such as the type of<br />
investment, and the volume and level of activity for that investment or similar<br />
investments in the marketplace. The inputs will be considered by the Investment<br />
Manager, along with any other relevant factors in the calculation of an<br />
investment’s fair value. The Fund uses prices and inputs that are current as of the<br />
measurement date, which may include periods of market dislocations. During<br />
these periods, the availability of prices and inputs may be reduced for many<br />
investments. This condition could cause an investment to be reclassified between<br />
the various levels within the hierarchy.<br />
The accompanying notes are an integral part of these financial statements.<br />
31