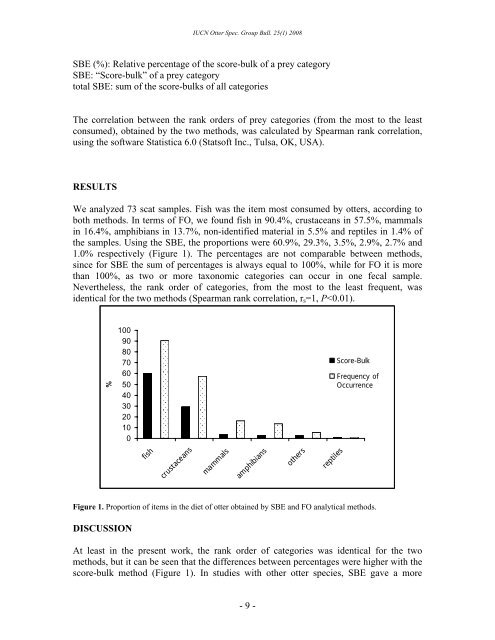
IUCN <strong>Otter</strong> Spec. <strong>Group</strong> Bull. 25(1) 2008SBE (%): Relative percentage of the score-bulk of a prey categorySBE: “Score-bulk” of a prey categorytotal SBE: sum of the score-bulks of all categoriesThe correlation between the rank orders of prey categories (from the most to the leastconsumed), obtained by the two methods, was calculated by Spearman rank correlation,using the software Statistica 6.0 (Statsoft Inc., Tulsa, OK, USA).RESULTSWe analyzed 73 scat samples. Fish was the item most consumed by otters, according toboth methods. In terms of FO, we found fish in 90.4%, crustaceans in 57.5%, mammalsin 16.4%, amphibians in 13.7%, non-identified material in 5.5% and reptiles in 1.4% ofthe samples. Using the SBE, the proportions were 60.9%, 29.3%, 3.5%, 2.9%, 2.7% and1.0% respectively (Figure 1). The percentages are not comparable between methods,since for SBE the sum of percentages is always equal to 100%, while for FO it is morethan 100%, as two or more taxonomic categories can occur in one fecal sample.Nevertheless, the rank order of categories, from the most to the least frequent, wasidentical for the two methods (Spearman rank correlation, r s =1, P
IUCN <strong>Otter</strong> Spec. <strong>Group</strong> Bull. 25(1) 2008reliable result, showing with more accuracy the proportion of prey than the FO (Wise etal., 1981; Jacobsen and Hansen, 1996; Carss and Parkinson, 1996; Anoop and Hussain,2005). However, the rank order of categories is usually the same for both methods (Wiseet al., 1981; Jacobsen and Hansen, 1996; Anoop and Hussain, 2005).A problem that may be found is that the different prey categories may have differentdegrees of digestibility (Putnam, 1984; Zabala and Zuberogoitia, 2003), so that quantityand volume of non-digested parts that are eliminated may vary, according to the kind ofprey. For example, different prey categories are likely to present different surface area /volume relations, which may influence digestibility. Besides, animals which have rigiddigestion–resistant exoskeletons, such as the crustaceans, could be overestimated.However, in this study, crustacean importance, as estimated by SBE, was not high,probably due to the many fish scales and bones found on the scats. The parts of fish eatenby Neotropical otter in this study had many big scales and bones, increasing theimportance of the “fish” category on SBE. The advantage in using a method like the SBEis to establish a more realistic relationship between the smaller and bigger fragments ofprey (Wise et al., 1981; Jacobsen and Hansen, 1996).We conclude that the most viable recommendation for dietary studies would be an indexcombining two or more analytical methods, one volumetric, such as SBE, and the otherfrequency-based, such as FO. This could combine the information of how frequently acertain prey taxa is consumed with how much it is consumed, offering then a moreoverall view of the feeding habits. Therefore we suggest such an index, the RescaledImportance Index (RII), as follows.The importance (I) of each prey category, i, can be expressed, for each of n preycategories, as:It is useful to rescale I i by dividing it by the sum of I’s for all prey categories; the result isthe Rescaled Importance Index for each category (RII i ):In this way the result, RII i now varies from 0 to 1. This index expresses the importance ofeach prey category in a single value, taking in account both its frequency and its volume.An useful property of RII is that:This property allows that the RII i can be meaningfully compared with the RII i for thatsame category in other studies, carried out at different places or with different species.- 10 -