2011 Pan-European Private Equity Performance ... - EVCA
2011 Pan-European Private Equity Performance ... - EVCA
2011 Pan-European Private Equity Performance ... - EVCA
- No tags were found...

You also want an ePaper? Increase the reach of your titles
YUMPU automatically turns print PDFs into web optimized ePapers that Google loves.
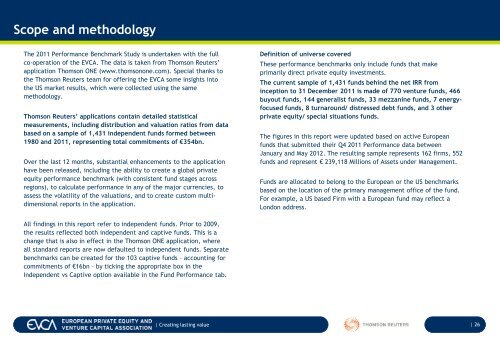
Scope and methodologyThe <strong>2011</strong> <strong>Performance</strong> Benchmark Study is undertaken with the fullco-operation of the <strong>EVCA</strong>. The data is taken from Thomson Reuters’application Thomson ONE (www.thomsonone.com). Special thanks tothe Thomson Reuters team for offering the <strong>EVCA</strong> some insights intothe US market results, which were collected using the samemethodology.Thomson Reuters’ applications contain detailed statisticalmeasurements, including distribution and valuation ratios from databased on a sample of 1,431 independent funds formed between1980 and <strong>2011</strong>, representing total commitments of €354bn.Over the last 12 months, substantial enhancements to the applicationhave been released, including the ability to create a global privateequity performance benchmark (with consistent fund stages acrossregions), to calculate performance in any of the major currencies, toassess the volatility of the valuations, and to create custom multidimensionalreports in the application.Definition of universe coveredThese performance benchmarks only include funds that makeprimarily direct private equity investments.The current sample of 1,431 funds behind the net IRR frominception to 31 December <strong>2011</strong> is made of 770 venture funds, 466buyout funds, 144 generalist funds, 33 mezzanine funds, 7 energyfocusedfunds, 8 turnaround/ distressed debt funds, and 3 otherprivate equity/ special situations funds.The figures in this report were updated based on active <strong>European</strong>funds that submitted their Q4 <strong>2011</strong> <strong>Performance</strong> data betweenJanuary and May 2012. The resulting sample represents 162 firms, 552funds and represent € 239,118 Millions of Assets under Management.Funds are allocated to belong to the <strong>European</strong> or the US benchmarksbased on the location of the primary management office of the fund.For example, a US based Firm with a <strong>European</strong> fund may reflect aLondon address.All findings in this report refer to independent funds. Prior to 2009,the results reflected both independent and captive funds. This is achange that is also in effect in the Thomson ONE application, whereall standard reports are now defaulted to independent funds. Separatebenchmarks can be created for the 103 captive funds – accounting forcommitments of €16bn – by ticking the appropriate box in theIndependent vs Captive option available in the Fund <strong>Performance</strong> tab.| Creating lasting value | 26