Downloaded By: [Canadian Research Knowledge Network] At: 21:10 26 March 2011overexcitability, rather than justexcitability, was chosen to convey theidea that this is a special kind <strong>of</strong>excitability, one that is enhanced and distinguishedby characteristic forms <strong>of</strong>expression. Dabrowski's theory hasengaged theorists, researchers, and educatorsin the field <strong>of</strong> gifted education formany years. Researchers, intrigued bythe blending <strong>of</strong> affective and cognitivedomains, have developed tools—first,the <strong>Overexcitability</strong> Questionnaire(OEQ) and, then, the OEQII—to helpilluminate and measure heightened manifestations<strong>of</strong> overexcitabilities.Group Characteristics and<strong>Overexcitabilities</strong>Researchers, using an open-endedquestionnaire, examined pr<strong>of</strong>iles <strong>of</strong> OEsamong gifted individuals and found similarpatterns among various subgroups.Several studies found differences in OEsamong children and adolescents, withthose students identified as gifted scoringhigher than their nongifted peers(Gallagher, 1986; Piechowski & Colangelo,1984). Some OEs were moreprevalent in artists (Piechowski & Cunningham,1985; Piechowski, Silverman,& Falk, 1985), and these tended to havegreater strength in more creative, giftedadolescents than less creative ones(Schiever, 1985). Ely (1995) found nostatistical differences between groupmeans <strong>of</strong> creative students who had notbeen identified for gifted services andintellectually gifted students who hadbeen identified for gifted programs.However, when she conducted a discriminantfunction analysis (DEA), she foundthat the linear function <strong>of</strong> Intellectualand Emotional OEs best predictedwhether students were classified as creativelyor intellectually gifted. In anotherstudy <strong>of</strong> gifted, near-gifted, and nongiftedstudents, Breard (1995) found that theIntellectual and Emotional OEs best predictedgroup membership. Additionally,Miller, Silverman, and Falk (1994)found gender differences in whichfemales had significantly higher Emotionaland Sensual OE scores than males.In one <strong>of</strong> the few studies that examinedpr<strong>of</strong>iles <strong>of</strong> OEs between gifted and typicalstudents, Ackerman (1997) foundthat Grade 9 and 10 gifted students whowere enrolled in two private schoolswere differentiated from their nongiftedpeers based on their higher Psychomotor,Intellectual, and Emotional OEscores, with Psychomotor providing thebest predictor or giftedness.Previous discussions (Ackerman,1997; Ely, 1995; Nelson, 1989;O'Connor, 2002; Silverman, 1993) havedescribed the role <strong>of</strong> the OEs as a meansto describe the intensity <strong>of</strong>ten demonstratedby gifted, talented, and creativestudents. Gifted students, by nature <strong>of</strong>their maturational and intellectual asynchrony(Hollingworth, 1929; Lovecky,2004; Silverman), may be more susceptibleto these intensities, which then affecttheir reactions to and interactions withtheir world. Few empirical studies, however,have explored the utility <strong>of</strong> the OEsas a tool for uncovering evolving pr<strong>of</strong>iles<strong>of</strong> OEs for gifted students in elementaryand middle school. The purpose <strong>of</strong> thisstudy was to describe and explain differencesbetween gender, age, and typicaland gifted groups on the overexcitabilitiesand to illuminate issues that mayaffect patterns <strong>of</strong> OEs in elementary- andmiddle-school gifted students. Previousresearch on OEs has led to the identification<strong>of</strong> several questions about potentialdifferences between groups:1. Do males and females differ inmean OE scores?2. Do elementary- and middleschoolstudents differ in meanOE scores?3. Do typical and GT students differin their mean OE scores?4. Do gifted, elementary-schoolstudents differ from their middleschoolpeers in their mean OEscores?MethodsTo address the research questions, asurvey using a convenience sample <strong>of</strong>typical and gifted students wasemployed. Data were analyzed usingdescriptive and multivariate analyses andcommon post-hoc procedures.SampleThe convenience sample consisted <strong>of</strong>510 elementary and secondary studentsfrom five diverse school districts throughoutthe east coast <strong>of</strong> the United States.Making up the valid responses were 263females and 217 males, 249 elementaryschoolers and 231 middle-school students,and 184 typical and 296 gifted students.For the purposes <strong>of</strong> this study,students classified as GT were identifiedusing a multifaceted state matrix. A minimumscore on standardized tests <strong>of</strong>achievement, ability, or creativity representsthe baseline for placement in GTservices, so students classified as giftedwere identified through similar measures.There is no delineation among studentsbased on identification by ability orachievement scores (i.e., highly gifted,talent pool, etc.). Students identified astypical include some students with identifiedlearning disabilities. The age <strong>of</strong> theparticipants ranged from 7 to 15 becausesome secondary students with learningdisabilities were older than typical middle-school-agestudents.ProcedureThe OEQII (Falk, Lind, Miller,Piechowski, & Silverman, 1999) and abrief demographic questionnaire wereadministered to participants. The OEQIIconsists <strong>of</strong> 50 Likert-type items thatmeasure each <strong>of</strong> the five OEs: Psychomotor,Intellectual, Imaginational,Sensual, and Emotional (Bouchet &Falk, 2001). It was adapted fromresponses by children and adults to anearlier questionnaire (OEQ) that used 21open-ended interview questions(Piechowski et al., 1985). Means (withstandard deviations in parentheses) forthe five subscales <strong>of</strong> OEs. from the originalOEQ pilot study (N = 563 collegestudents aged 15-62) were 3.35 (.79) forPsychomotor, 3.28 (.87) for Sensual,2.86 (.83) for Imaginational, 3.50 (.79)for Intellectual, and 3.72 (.77) for Emotional.The pilot study was repeated withan additional sample <strong>of</strong> 324 students,49% <strong>of</strong> whom were 17 years old oryounger. Original alpha reliability estimatesfrom the pilot sample using theoriginal OEQ were .86 for Psychomotor,.89 for Intellectual, .89 for Sensual, .84for Emotional, and .85 for ImaginationalOEs (Falk et al., 1999).Dr this study, researchers solicitedassistance from preserviceteachers enrolled in a university GT certificationprogram. Local GT teachersinvited their school colleagues and theirgifted and typical students to participatein this study. The OEQII and demographicquestionnaires were distributedto study participants during the falls <strong>of</strong>2003 and 2004 and took approximately15 minutes to complete. Informed consentand assent was solicited from parentsand students prior to administration<strong>of</strong> the questionnaires. Participants wereinformed that their participation was voluntaryand that they would not be punishedin any way if they decided not toparticipate or to withdraw. Students werepromised a small gift by returning completedquestionnaires.Summer, 2007, Roeper Review/233
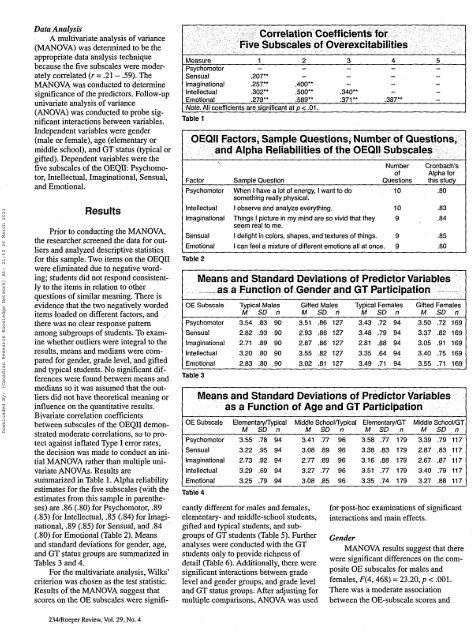
• • - . • • • • • . • . • • . •. . • - . . - , . . . • • • . - - , - ' : . - . • • " : . • ' . ' . . . . : . . ' • • . - • _ • . - . • • — - , > • • • " • • . - . • l r ; • v • . . - ' • . . . • ' , - . . . • • . • . • - • • . : . • •. • • - • — :Downloaded By: [Canadian Research Knowledge Network] At: 21:10 26 March 2011Data AnalysisA multivariate analysis <strong>of</strong> variance(MANOVA) was detennined to be theappropriate data analysis techniquebecause the five subscales were moderatelycorrelated (r = .21 - .59). TheMANOVA was conducted to determinesignificance <strong>of</strong> the predictors. Follow-upunivariate analysis <strong>of</strong> variance(ANOVA) was conducted to probe significantinteractions between variables.Independent variables were gender(male or female), age (elementary ormiddle school), and GT status (typical orgifted). Dependent variables were thefive subscales <strong>of</strong> the OEQII: Psychomotor,Intellectual, Imaginational, Sensual,and Emotional.ResultsPrior to conducting the MANOVA,the researcher screened the data for outliersand analyzed descriptive statisticsfor this sample. Two items on the OEQIIwere eliminated due to negative wording;students did not respond consistentlyto the items in relation to otherquestions <strong>of</strong> similar meaning. There isevidence that the two negatively wordeditems loaded on different factors, and .there was no clear response patternamong subgroups <strong>of</strong> students. To examinewhether outliers were integral to theresults, means and medians were comparedfor gender, grade level, and giftedand typical students. No significant differenceswere found between means andmedians so it was assumed that the outliersdid not have theoretical meaning orinfluence on the quantitative results.Bivariate correlation coefficientsbetween subscales <strong>of</strong> the OEQII demonstratedmoderate correlations, so to protectagainst inflated Type I error rates,the decision was made to conduct an initialMANOVA rather than multiple univariateANOVAs. Results aresummarized in Table 1. Alpha reliabilityestimates for the five subscales (with theestimates from this sample in parentheses)are .86 (.80) for Psychomotor, .89(.83) for Intellectual, .85 (.84) for Imaginational,.89 (.85) for Sensual, and .84(.80) for Emotional (Table 2). Meansand standard deviations for gender, age,and GT status groups are summarized inTables 3 and 4.For the multivariate analysis, Wilks'criterion was chosen as the test statistic.Results <strong>of</strong> the MANOVA suggest thatscores on the OE subscales were signifi-234/Roeper Review, Vol. 29, No. 4MeasurePsychomotorSensualImaginationalIntellectualEmotionalCorrelation Coefficients forFive Subscales <strong>of</strong> <strong>Overexcitabilities</strong>.207**.257**.302**.279**.400".500".589"Note. All coefficients are significant at p < .01.Table 1.340*.371* .387*OEQII Factors, Sample Questions, Number <strong>of</strong> Questions,and Alpha Reliabilities <strong>of</strong> the OEQII SubscalesFactorPsychomotorIntellectualImaginationalSensualEmotionalTable 2Sample QuestionWhen I have a lot <strong>of</strong> energy, I want to dosomething really physical.I observe and analyze everything.Things I picture in my mind are so vivid that theyseem real to me.I delight in colors, shapes, and textures <strong>of</strong> things.Number<strong>of</strong>QuestionsI can feel a mixture <strong>of</strong> different emotions all at once. 9101099Cronbach'sAlpha forthis studyMeans and Standard Deviations <strong>of</strong> Predictor Variablesa Function <strong>of</strong> Gender and GT Participation_ asOE SubscalePsychomotorSensualImaginationalIntellectualEmotionalTable 3OE SubscalePsychomotorSensualImaginationalIntellectualEmotionalTable 4Typical MalesM SD n3.54 .83 902.82 .93 902.71 .89 903.20 .80 902.83 .80 90Gifted MalesM SD n3.51 .86 1272.93 .86 1272.87 .86 1273.55 .82 1273.02 .81 127.80.83.84.85.80Typical Females Gifted FemalesM SD n M SD n3.43 .72 94 3.503.48 .79 94 3.372.81 .88 94 3.053.35 .64 94 3.403.49 .71 94 3.55Means and StandarcI Deviations <strong>of</strong> Predictor Variablesasa Function <strong>of</strong> Age and GT ParticipationElementary/TypicalM SD n3.55 .78 943.22 .95 942.73 .92 943.29 .69 943.25 .79 94cantly different for males and females,elementary- and middle-school students,gifted and typical students, and subgroups<strong>of</strong> GT students (Table 5). Furtheranalyses were conducted with the GTstudents only to provide richness <strong>of</strong>detail (Table 6). Additionally, there weresignificant interactions between gradelevel and gender groups, and grade leveland GT status groups. After adjusting formultiple comparisons, ANOVA was usedMiddle School/TypicalM SD n3.41 .77 963.08 .89 962.77 .89 963.27 .77 963.08 .85 96Elementary/GTM SD n3.58 .77 1793.38 .83 1793.16 .88 1793.51 .77 1793.35 .74 179.72.82.91.75.71169169169169169Middle School/GTM3.39SD.79n1172.872.673.403.27.83.87.79.88117117117117forpost-hoc examinations <strong>of</strong> significantinteractions and main effects.GenderMANOVA results suggest that therewere significant differences on the compositeOE subscales for males andfemales, F(4,468) = 23.20, p < .001.There was a moderate associationbetween the OE-subscale scores and