AA+ - TELOS GmbH
AA+ - TELOS GmbH
AA+ - TELOS GmbH

You also want an ePaper? Increase the reach of your titles
YUMPU automatically turns print PDFs into web optimized ePapers that Google loves.
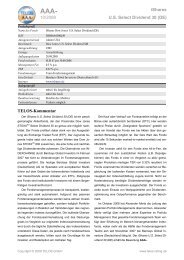
<strong>AA+</strong><br />
03/2008<br />
with the money market and a benchmark (where appropri-<br />
ate) in respect of performance and risk criteria. All calcula-<br />
tions are based on month-end data. Fund data and bench-<br />
mark data are provided by the investment firm.<br />
The performance of the fund is calculated based on re-<br />
invested prices: profit distributions are being invested in<br />
new shares of the fund immediately. Thereby, the perform-<br />
ance of distributing and nondistributing funds is mutually<br />
comparable. This approach corresponds to the “BVI meth-<br />
od” of performance calculation, advocated by the associ-<br />
ation of the German investment fund industry. If the fund<br />
management is guided by a benchmark, the performance<br />
of the latter is shown as well. Otherwise, a suitable com-<br />
parative index is chosen for illustration purposes – in<br />
agreement with the investment firm.<br />
The Sharpe Ratio provides information about the “ex-<br />
cess return” of the fund with regard to a risk free financial<br />
investment – here represented by the money market – as<br />
a proportion of the total risk taken. The risk free rate used<br />
in this report is 4%, and the volatility is the annualised<br />
standard deviation of the monthly returns.<br />
The median of monthly results is characterised by the<br />
fact that half of all monthly returns occurring in the ob-<br />
served period are either at least or at most as large as this<br />
value. As a result, this measure is less sensitive to “outlier<br />
results” than, for instance, the mean (average) value of<br />
monthly returns. In an analogous way, the median of 12-<br />
month results should be interpreted. The longest loss peri-<br />
od is the number of months needed by the fund in order to<br />
recover losses by reaching or exceeding a level that had<br />
been achieved previously in the period under considera-<br />
tion. If this level could not be reached again, the end of the<br />
period is used. Accordingly, the maximum loss amount is<br />
the largest loss which the fund suffered in the period under<br />
Life Settlements Portfolio<br />
consideration – starting from the highest value reached<br />
earlier during this period.<br />
Jensen Alpha measures the beta-risk-adjusted (cf.<br />
beta) outperformance of the fund versus the benchmark<br />
and is calculated using monthly returns. A positive value<br />
indicates the generation of added-value by the fund's<br />
management.<br />
Beta is a measure of the fund's market risk exposure. A<br />
Beta larger (smaller) than one indicates that the fund will<br />
be more (less) volatile than the benchmark.<br />
R² is the square of the correlation coefficient (cf. correl-<br />
ation). It is the measure of the quality of a linear fit on the<br />
fund's vs. the market's returns. It ranges between 0 (bad<br />
fit) and 1 (good fit).<br />
Correlation is a measure of how the fund and the mar-<br />
ket move in relation to each other. Correlation ranges<br />
between -1 and +1. The extreme values i.e. -1/+1 indicate<br />
that the fund and the market always move in lockstep, for<br />
-1 in opposite directions, for +1 in the same direction. 0<br />
indicates there is no clear relationship.<br />
The tracking error is the standard deviation of differ-<br />
ences between fund and benchmark returns. The lower<br />
the tracking error, the more closely the portfolio follows the<br />
index.<br />
Active Premium or excess return measures the<br />
Out/Underperformance of a fund vs. its benchmark.<br />
The Information Ratio is the active Premium divided by<br />
the tracking error. The higher the information ratio, the<br />
higher the active premium of the fund, given the same<br />
level of risk.<br />
The Treynor Ratio is the active premium divided by<br />
beta. The Treynor ratio is a beta-risk-adjusted measure of<br />
excess return.<br />
All rights reserved. The current version of this report can be obtained from our website www.telos-rating.de. This rating report is<br />
based on facts and information taken from sources believed reliable, but we cannot warrant their accuracy and/or completeness. TE-<br />
LOS <strong>GmbH</strong> accepts no liability for any loss or damage arising from errors or matters of opinion expressed. Neither the presented figures<br />
nor the actual historical performance permit future predictions. Ratings and views presented are subject to revision and should not<br />
solely be relied upon for investment decisions. The Fund rating is no offer or recommendation or request to buy, sell or hold the<br />
product(s) being discussed in this publication. The current version of this report may be obtained from our website.<br />
Copyright © 2008 <strong>TELOS</strong> <strong>GmbH</strong> www.telos-rating.de