

n?u=RePEc:bdi:wptemi:td_1011_15&r=eff
n?u=RePEc:bdi:wptemi:td_1011_15&r=eff
n?u=RePEc:bdi:wptemi:td_1011_15&r=eff
- No tags were found...

You also want an ePaper? Increase the reach of your titles
YUMPU automatically turns print PDFs into web optimized ePapers that Google loves.
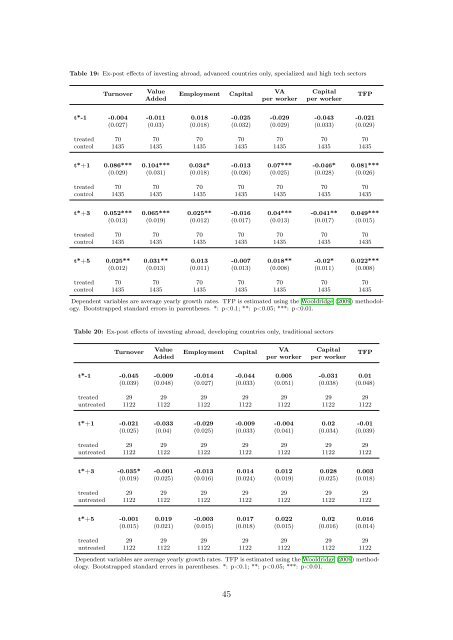
Table 19: Ex-post effects of investing abroad, advanced countries only, specialized and high tech sectorsTurnoverValueEmployment CapitalVA CapitalAdded per worker per workerTFPt*-1 -0.004 -0.011 0.018 -0.025 -0.029 -0.043 -0.021(0.027) (0.03) (0.018) (0.032) (0.029) (0.033) (0.029)treated 70 70 70 70 70 70 70control 1435 1435 1435 1435 1435 1435 1435t*+1 0.086*** 0.104*** 0.034* -0.013 0.07*** -0.046* 0.081***(0.029) (0.031) (0.018) (0.026) (0.025) (0.028) (0.026)treated 70 70 70 70 70 70 70control 1435 1435 1435 1435 1435 1435 1435t*+3 0.052*** 0.065*** 0.025** -0.016 0.04*** -0.041** 0.049***(0.013) (0.019) (0.012) (0.017) (0.013) (0.017) (0.015)treated 70 70 70 70 70 70 70control 1435 1435 1435 1435 1435 1435 1435t*+5 0.025** 0.031** 0.013 -0.007 0.018** -0.02* 0.022***(0.012) (0.013) (0.011) (0.013) (0.008) (0.011) (0.008)treated 70 70 70 70 70 70 70control 1435 1435 1435 1435 1435 1435 1435Dependent variables are average yearly growth rates. TFP is estimated using the Wooldridge (2009) methodology.Bootstrapped standard errors in parentheses. *: p
