OPUS - UrbanSim
OPUS - UrbanSim
OPUS - UrbanSim
- No tags were found...

You also want an ePaper? Increase the reach of your titles
YUMPU automatically turns print PDFs into web optimized ePapers that Google loves.
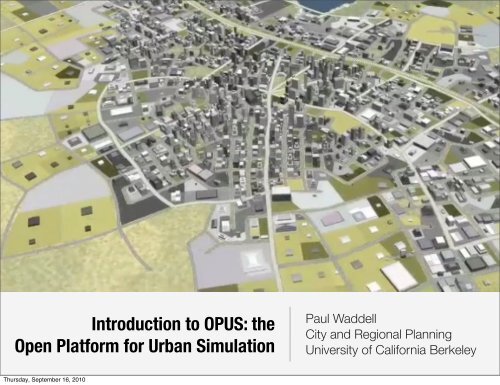
Introduction to <strong>OPUS</strong>: theOpen Platform for Urban SimulationPaul WaddellCity and Regional PlanningUniversity of California BerkeleyThursday, September 16, 2010
P. Waddell, 2010Introduction to the Open Platform for Urban Simulation• First Steps- Installing <strong>OPUS</strong> and <strong>UrbanSim</strong>- Launching <strong>OPUS</strong>- Loading a Project• The <strong>OPUS</strong> Graphical User Interface- Data- Models- Scenarios- Results• Under the hood- <strong>OPUS</strong> data- Project XML filesThursday, September 16, 2010
P. Waddell, 2010Installing <strong>OPUS</strong> and <strong>UrbanSim</strong>• <strong>OPUS</strong> and <strong>UrbanSim</strong> run on most platforms. There are fairly detailed installationinstructions at: http://www.urbansim.org/Download• For Windows platforms (32 bit), including Windows XP and Windows 7- A full installer is available on the download page, with instructions. At this time,version 4.3 is recommended (it is still listed as a development release but is quitestable, and will be finalized as a stable release shortly)- A couple of caveats:• The installer uses Python 2.6, and ArcGIS installs Python 2.5, so please consult the notes here on handlingthe multiple versions of Python between ArcGIS and <strong>OPUS</strong>: http://www.urbansim.org/Download/ArcGIS• Windows 32bit only allocates up to 3GB RAM to a process, even if your computer has more. This can bean issue for larger metropolitan areas. Recommendation: move to a 64bit Windows and Python install.• Vista has caused problems for many users and is not supported• For Windows 64 bit (XP, 7, and others):- There are notes on installing here:• http://www.urbansim.org/Download/SixtyFourBitMachines- No installer at this time, so process is a bit more manual than for 32 bit WindowsThursday, September 16, 2010
P. Waddell, 2010Installing <strong>OPUS</strong> and <strong>UrbanSim</strong>• For Linux users- Install instructions are here: http://www.urbansim.org/Download/LinuxInstallation- And for Ubuntu specifically: http://www.urbansim.org/Research/SustainCity/<strong>UrbanSim</strong>InstallationInstructionsForUbuntu- The installation process is quite straightforward and usually does not havecomplications, even though there is no installer• For Mac users (Intel)- Install instructions are here: http://www.urbansim.org/Download/MacintoshInstallation- Unfortunately, installing on the Mac is the hardest due to the multiple ways Pythoncan be installed. It is getting easier with dmg-based installation of packages, but stillmore complex and time consuming than for either Windows or Linux. But it runsreally well once installed!Thursday, September 16, 2010
P. Waddell, 2010Launching <strong>OPUS</strong>• To use <strong>UrbanSim</strong>, you have to run <strong>OPUS</strong>, since <strong>UrbanSim</strong> is implemented in the<strong>OPUS</strong> software platform developed by the <strong>UrbanSim</strong> development team as ageneral, open source simulation platform.• Two ways to run <strong>UrbanSim</strong> (and <strong>OPUS</strong>)- Launch the <strong>OPUS</strong> GUI• From the Program/Start menu in Windows if you ran the installer• From the Command Line Interface (CLI): in a command shell- Launch an <strong>UrbanSim</strong> simulation on a scenario or run a tool, from the command line• Environment variables- Environment variables are set by the installer, and if doing a manual install should beset manually:• PYTHONPATH = path to opus/src• <strong>OPUS</strong>_HOME = path to opus• <strong>OPUS</strong>_DATA_PATH = path to data if not in the default location of opus/dataThursday, September 16, 2010
P. Waddell, 2010Launching the <strong>OPUS</strong> Graphical User Interface (GUI)• Go ahead and start the <strong>OPUS</strong> GUI. It looks like this on a Mac, and will lookmodestly different on different platforms:Thursday, September 16, 2010
P. Waddell, 2010Launching the <strong>OPUS</strong> Graphical User Interface (GUI)• On the mac the menu bar is not within the main GUI window, but in the systemtop bar. Otherwise the window is similar except for minor style differences.Note that most of this real estate is initially empty. This is because wehave not loaded a ‘project’ yet. The GUI content is loaded fromproject files, which contain details on models and data to be used,and are stored in an XML file.Thursday, September 16, 2010
P. Waddell, 2010Loading a Project File in the <strong>OPUS</strong> GUI• Let’s start by opening a sample project in the GUI: eugene_gridcell_default.xmlNow that we have loaded a project,you will see new content, initially in theleft-hand frame, which containsconfiguration information in ahierarchical structure, and contextsensitivemenus that can be launchedby right-clicking on certain types of‘nodes’ in the outline.Note the ‘tabs’ which provide a toplevelorganization: general, data,models, scenarios, and results.Thursday, September 16, 2010
P. Waddell, 2010Organization in the <strong>OPUS</strong> GUI• General- Added to accommodate any configuration details that were not easy to fit into thefollowing categories, or were more general and need to be accessed from multiplelocations in the GUI - or from different work tasks. Like the variable library which iscentral to how to define variables or indicators.• Data- Contains an <strong>OPUS</strong>-Centric view of the data to be used in an <strong>UrbanSim</strong> application- <strong>OPUS</strong> Datasets can be viewed (these are actually Numpy arrays stored on disk)- Data can be imported to <strong>OPUS</strong> from SQL databases, or exported to them- Data can also be imported and exported to ESRI geodatabases- <strong>OPUS</strong> Datasets can also be exported to ASCII tab-delimited files (but not importedfrom them)- ESRI geoprocessing tools can be configured and submitted for running by ArcGIS- Tools can be added by users to extend this interface, much like in ArcGIS Toolbox- Tools can be grouped and run as a batch of tools, run in a sequenceThursday, September 16, 2010
P. Waddell, 2010Organization in the <strong>OPUS</strong> GUI• Models- Contains the configuration of models used for this project- Allows new models to be added, from templates- Allows models to be ‘specified’: variables added to equations- Allows models to be ‘estimated’: finds the parameters of the model using OrdinaryLeast Squares for Regression models, and Maximum Likelihood Estimation forchoice models• Scenarios- Allows creating configurations for different scenarios to be run- Provides an interface to run a simulation on a scenario and to monitor it• Results- Allows creating configurations of indicators and how to display them (tables, maps,animated maps)- Provides an interface to run the indicators and view themThursday, September 16, 2010
P. Waddell, 2010<strong>OPUS</strong> Data ToolsTo execute a tool, right-click on it in theleft-hand frame and a new dialog boxwill pop up.Thursday, September 16, 2010
P. Waddell, 2010<strong>OPUS</strong> Data ToolsTo execute a tool, right-click on it in theleft-hand frame and a new dialog boxwill pop up.Thursday, September 16, 2010
P. Waddell, 2010Viewing <strong>OPUS</strong> DataClick on the Opus Data sub-tab underData, and you will get a directory of thedata on disk that is associated withthis project, organized intobase_year_data, runs, and shapefiles.Open base_year_data and you will seeyear subdirectories (in Eugene thereare some historical years before theactual base year of 1980 for thisproject), so open 1980.Now you see the Opus Datasets thatcomprise the <strong>UrbanSim</strong> application.Thursday, September 16, 2010
P. Waddell, 2010Viewing <strong>OPUS</strong> DataIf you right-click on a dataset ‘node’you get a context-sensitive menu asshown at left. You can export data, orview it. Click on the View Datasetentry.Thursday, September 16, 2010
P. Waddell, 2010Viewing <strong>OPUS</strong> DataViewing an Opus Dataset opens a newframe on the right hand side, with astatistical summary of the data, and abrowsable window to see the data.You cannot edit the data directly at thistime - this is only a display of the data.Thursday, September 16, 2010
P. Waddell, 2010<strong>OPUS</strong> Data• Where do the <strong>OPUS</strong> Data actually reside on the computer?- The default location is under opus/data, but if you chose a different location for it, itwould be the path that is in the environment variable <strong>OPUS</strong>_DATA_PATH- Under the main data directory are project directories. The installation comes withtwo sample projects (and more may be added soon):• eugene_gridcell• seattle_parcel- These directory names should match the project name in a project xml file- Under each of these directories, in normal use there will be 3 subdirectories:• base_year_data: this contains a year subdirectory and under that, directories for each dataset• runs: this may not exist until a scenario has been run, but then contains a subdirectory for each run• shapefiles: this directory is a special one for creating a modified ESRI shapefile for use in mapping indicators• A reminder: all the files in the dataset directories are actually individual Numpyarrays, but <strong>OPUS</strong> ‘knows’ how to load them as needed and treat them as tablesThursday, September 16, 2010
P. Waddell, 2010<strong>UrbanSim</strong> Base Year Data• In order to have a working <strong>UrbanSim</strong> model application, a Base Year Databasemust be developed. The sample projects are ones for which this process hasalready been completed, and copied to the <strong>OPUS</strong> data format (Numpy arrays)• The development of the base year database is covered in a separatepresentation.• The process of moving the data from a database (SQL) environment to the<strong>OPUS</strong> data format is referred to as ‘caching’ the database. The <strong>OPUS</strong> datastorage on disk is also sometimes referred to as the ‘cache’.Thursday, September 16, 2010
P. Waddell, 2010Inheritance in the GUILet’s open the land_price_model, andthe specification sub-node. Right clickon it. You will see an option to ‘Makenode local’. The same would be truefor other items printed in blue text.Blue items are actually not directly inour local project XML file we loaded.They are ‘inherited’ from a ‘parent’ fileand simply displayed here. To edit avalue that is inherited, it must becopied into the local project.Inheritance is like Master templates ina Powerpoint presentation...Thursday, September 16, 2010
P. Waddell, 2010Inheritance in the GUIIn the General tab, the second nodeshows what the ‘parent’ is of theproject file you have loaded. It isanother xml file, in the location shown,under the opus/src directory.The parent xml file may also inheritcontent from another, more general,parent xml file. This is how we make itpossible to extend projects by addingmore general functionality at a higherlevel, which becomes automaticallyavailable to all ‘child’ projects.Thursday, September 16, 2010
P. Waddell, 2010Model SpecificationAfter ‘Making nodelocal’, you can rightclickor double-click topop up a window withthe editable modelspecification. It allowsadding and droppingvariables to the model.Thursday, September 16, 2010
P. Waddell, 2010Editing a Model SpecificationEditing a modelspecification involvesadding or droppingvariables, using asimple selection of oneor more variables toadd and then clickingthe add button, ordoing the same on theright to drop them.But where do thesevariables come from?Thursday, September 16, 2010
P. Waddell, 2010The Variable LibraryVariables live in the VariableLibrary, which you canopen using a menu item orthe icon that looks like abook.It contains a name (alias),what dataset the variable isassociated with, its use (ina Model, as an Indicator, orBoth), its type (Expressionor Python Module), andthen its ‘definition’, whichis an <strong>OPUS</strong> ExpressionThursday, September 16, 2010
P. Waddell, 2010Editing or Adding Variables to the Library• Variables can be inherited also (anything in the project can be), so if you want toedit one, you will need to make it local.• If you right-click on a variable, you can ‘view its dependencies’, or find out whatvariables or primary attributes it depends on in order to compute it:Thursday, September 16, 2010
P. Waddell, 2010Editing or Adding Variables to the Library• Or you can edit the variable, which brings up this dialog:Thursday, September 16, 2010
P. Waddell, 2010Editing or Adding Variables to the Library• Or you can edit the variable, which brings up this dialog:Notice that you can usethe buttons at the bottomto have the system checkthe syntax of the variableyou have edited or added.Hopefully you will mostlysee the popup window likethe one on the left...Thursday, September 16, 2010
P. Waddell, 2010Editing or Adding Variables to the Library• Or you can edit the variable, which brings up this dialog:If you check it againstdata, it actually computesthe variable on the realdata available for thisproject -- a great way toensure that it is workingnot only ‘in theory’, butwith your actual data!Thursday, September 16, 2010
P. Waddell, 2010Estimating Model ParametersTo run a model estimationprocess, we need to goback to the model in theModels tab, and right-clickon its name (its mainnode), and then select theoption ‘Run Estimation’.This will open a frame onthe right, with a prominentbutton ‘Start Estimation’.Thursday, September 16, 2010
P. Waddell, 2010Estimating Model ParametersIf everything is in order, weshould quickly see theestimation resultsmaterialize in the display.Thursday, September 16, 2010
P. Waddell, 2010Estimating Model ParametersAfter experimenting, once you are happywith the results, you can save them to thedisk for use in simulation, by clicking onthe check box under EstimationConfiguration, labeledsave_estimation_results. You will need torun estimation again to actually save them.Thursday, September 16, 2010
P. Waddell, 2010Running a ScenarioOnce you have a set of models that havebeen estimated, you can configure ascenario to run a simulation over aspecified set of years.Let’s open an example, Eugene_baseline,which is set up to run by default just1981-82, for demonstration purposes.Right-click on the name of the scenario,and select Run Scenario. You should geta new frame like this.Thursday, September 16, 2010
P. Waddell, 2010Running a ScenarioWhile the simulation runs, youwill see progress bars andother information updated onthe right. You can also see alog of more detailedinformation scrolling across acommand shell window, or inthe log sub-tab of thesimulation frame.Thursday, September 16, 2010
P. Waddell, 2010Running a ScenarioHopefully at the end of thesimulation you get aconfirmation like that on theright. At this point, the resultshave been written to a runsfolder in the opus/data/projectdirectory, which we couldbrowse in the Data tab, orgenerate indicators from it inthe Results tab.Thursday, September 16, 2010
P. Waddell, 2010Generating IndicatorsThe Results tab allows you tocreate and view indicators.Let’s look at an existing onefor this project. A zone-levelsummary of jobs.Thursday, September 16, 2010
P. Waddell, 2010Generating IndicatorsRight-clicking on the indicatorand selecting ConfigureVisualization brings up thisdialog. Note that one indicatoris selected, and that it is at azone level, and of type Map.Now click on the Mapnik MapOptions.Thursday, September 16, 2010
P. Waddell, 2010Generating IndicatorsThis brings up a legend editor,much like the one in ArcView.Thursday, September 16, 2010
P. Waddell, 2010Generating IndicatorsNow you can right-click on the indicatorbatch (not the individual indicator) andselect what data you want to run theindicator on. I’ll choose base year, 1980.Thursday, September 16, 2010
P. Waddell, 2010Generating IndicatorsAnd here is the end result. Now --experiment!Thursday, September 16, 2010
P. Waddell, 2010Indicator Results• Where do the indicator results exist on the computer?• In addition to displaying them in the GUI, all indicator results are written to anindicators subdirectory, underneath the directory from which they were created- Example: if you generate an indicator map from a base_year_data, foreugene_gridcell, then you will find the result under: opus/data/eugene_gridcell/base_year_data/indicators- Example: if the indicator was generated from ‘run_XYZ’, then it would be found in:opus/data/eugene_gridcell/runs/run_XYZ/indicators• Note: we are beginning to develop a report generation capability that will make itpossible to present indicators as tables, charts and maps in a structureddocument, using html as the initial format.Thursday, September 16, 2010
P. Waddell, 2010Assignment 2• Take 5 variables in the Variable Library, and briefly explain what they are doing.(1-2 sentences)• Create 3 new zone-level indicators (you decide what to create), and plot them asmaps.• Due next WednesdayThursday, September 16, 2010