Ethnic Coefficients for Glomerular Filtration Rate Estimation by the ...
Ethnic Coefficients for Glomerular Filtration Rate Estimation by the ...
Ethnic Coefficients for Glomerular Filtration Rate Estimation by the ...
- No tags were found...

You also want an ePaper? Increase the reach of your titles
YUMPU automatically turns print PDFs into web optimized ePapers that Google loves.
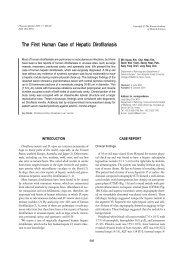
Lee CS, et al. • Korean <strong>Coefficients</strong> <strong>for</strong> <strong>the</strong> MDRD Study Equations120.0120.06060Equation 9 (mL/min/1.73 m 2 )100.080.060.040.020.00.0r 2 =0.73Equation 10 (mL/min/1.73 m 2 )100.080.060.040.020.00.0r 2 =0.722Eq9-Systemic inulin clearance(mL/min/1.73 m 2 )40200-20-40-60Eq10-Systemic inulin clearance(mL/min/1.73 m 2 )40200-20-40-600.0 20.0 40.0 60.0 80.0 100.0 120.0Systemic inulin clearance(mL/min/1.73 m 2 )0.0 20.0 40.0 60.0 80.0 100.0 120.0Systemic inulin clearance(mL/min/1.73 m 2 )0 50 100 150Systemic inulin clearance+Eq9)/2(mL/min/1.73 m 2 )0 50 100 150Systemic inulin clearance+Eq10)/2(mL/min/1.73 m 2 )120.0120.06060Equation 11 (mL/min/1.73 m 2 )100.080.060.040.020.00.0r 2 =0.754Equation 12 (mL/min/1.73 m 2 )100.080.060.040.020.00.0r 2 =0.757Eq11-Systemic inulin clearance(mL/min/1.73 m 2 )40200-20-40-60Eq12-Systemic inulin clearance(mL/min/1.73 m 2 )40200-20-40-600.0 20.0 40.0 60.0 80.0 100.0 120.0Systemic inulin clearance(mL/min/1.73 m 2 )0.0 20.0 40.0 60.0 80.0 100.0 120.0Systemic inulin clearance(mL/min/1.73 m 2 )0 50 100 150Systemic inulin clearance+Eq13)/2(mL/min/1.73 m 2 )0 50 100 150Systemic inulin clearance+Eq14)/2(mL/min/1.73 m 2 )120.0120.06060Equation 13 (mL/min/1.73 m 2 )100.080.060.040.020.00.0r 2 =0.718Equation 14 (mL/min/1.73 m 2 )100.080.060.040.020.00.0r 2 =0.719Eq13-Systemic inulin clearance(mL/min/1.73 m 2 )40200-20-40-60Eq14-Systemic inulin clearance(mL/min/1.73 m 2 )40200-20-40-600.0 20.0 40.0 60.0 80.0 100.0 120.0Systemic inulin clearance(mL/min/1.73 m 2 )0.0 20.0 40.0 60.0 80.0 100.0 120.0Systemic inulin clearance(mL/min/1.73 m 2 )A0 50 100 150Systemic inulin clearance+Eq15)/2(mL/min/1.73 m 2 )0 50 100 150Systemic inulin clearance+Eq16)/2(mL/min/1.73 m 2 )BFig. 2. Correlation of estimated glomerular filatration rate (eGFR) (equations 9-14) with systemic inulin clearance (reference GFR) (A) and Bland and Altman plots between eGFR(equations 9-14) and systemic inulin clearance (B) (n=147; excluding participants whose reference GFR exceeded 130 mL/min/1.73 m 2 ). (A) Black line: Identical line, gray line:Fit line between systemic inulin clearance and eGFR. Overestimation in advanced renal dysfunction or underestimation in near normal renal function was still observed. (B) Solidred line represents <strong>the</strong> regression line of difference between methods against average of methods. The mean difference is indicated <strong>by</strong> center line, limits of agreement areindicated <strong>by</strong> <strong>the</strong> upper (mean+2SD) and lower (mean−2SD) lines. Eq9-Eq10: The Modification of Diet in Renal Disease (MDRD) study equations using locally measured serumcreatinine (SCr) values <strong>by</strong> a Hitachi 7600 and multiplied <strong>by</strong> <strong>the</strong> Korean ethnic coefficients. Eq11-Eq14: Novel 4 and 6 variable equations using SCr values recalibrated to CX3analyzer (equations 11 and 12) and to Isotope Dilution Mass Spectrometry (IDMS) (equations 13 and 14).method using a Hitachi 7600 (equations 9 and 10) showed betterper<strong>for</strong>mance than did <strong>the</strong> original MDRD study equations(equations 1 and 2), although <strong>the</strong>se improvements were not alwaysstatistically significant. These results guarantee that wecould easily apply <strong>the</strong>se ethnic coefficients and equations <strong>for</strong>usual clinical practice in Korea. The modified MDRD study equationswith ethnic coefficients based on SCr recalibrated to CX3analyzer showed more underestimation. This finding may originatefrom our statistical intention to <strong>for</strong>ce <strong>the</strong> intercept to bezero to permit simple practical application. In fact, <strong>the</strong> interceptsof <strong>the</strong> modified MDRD equation were different from zero (22.37<strong>for</strong> <strong>the</strong> aMDRD and 21.74 <strong>for</strong> <strong>the</strong> 6 variable MDRD). Statisticaldesign <strong>for</strong>cing <strong>the</strong> intercept to be zero also explains <strong>the</strong> discrepanciesbetween <strong>the</strong> Korean coefficient of 0.74 and <strong>the</strong> Japanesecoefficient of 0.881 (8). Because <strong>the</strong> procedure of recalibrationto <strong>the</strong> CX3 analyzer is cumbersome and impractical as well, wesuggest that modification of <strong>the</strong> original abbreviated and 6 variableMDRD equations with 1.09825 and 1.04334 (based on <strong>the</strong>locally measured SCr values <strong>by</strong> <strong>the</strong> Jaffé method) would be moreclinically useful.Although modification of <strong>the</strong> MDRD study equations with <strong>the</strong>measured SCr values (equations 9 and 10) showed sufficientlygood slopes, biases, and accuracies, <strong>the</strong> ethnic coefficients of<strong>the</strong> IDMS MDRD study equations were close to ‘1’ and <strong>the</strong> modifiedIDMS MDRD study equations showed comparable per<strong>for</strong>manceto equations 9 and 10. IDMS, high order referencemethod, have been developed <strong>for</strong> <strong>the</strong> assignment of referencematerials and proficiency testing using a commutable specimenmade each institution derives <strong>the</strong> correlation coefficient <strong>for</strong> individualmeasurement methods versus reference measurement1622 http://jkms.org DOI: 10.3346/jkms.2010.25.11.1616