ECSS E 10-04 v0.10 - European Cooperation on Space Standardization ...
ECSS E 10-04 v0.10 - European Cooperation on Space Standardization ...
ECSS E 10-04 v0.10 - European Cooperation on Space Standardization ...
You also want an ePaper? Increase the reach of your titles
YUMPU automatically turns print PDFs into web optimized ePapers that Google loves.
8<br />
<str<strong>on</strong>g>ECSS</str<strong>on</strong>g>-E-<str<strong>on</strong>g>10</str<strong>on</strong>g>-<str<strong>on</strong>g>04</str<strong>on</strong>g>B (draft v0.<str<strong>on</strong>g>10</str<strong>on</strong>g>) 13/03/2008<br />
<strong>Space</strong> Envir<strong>on</strong>ment<br />
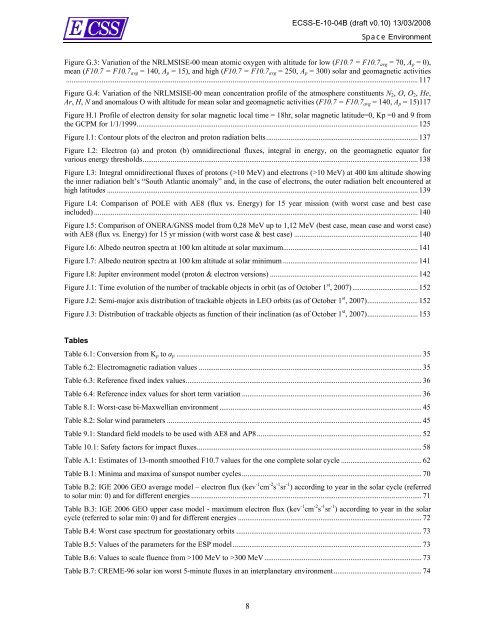
Figure G.3: Variati<strong>on</strong> of the NRLMSISE-00 mean atomic oxygen with altitude for low (F<str<strong>on</strong>g>10</str<strong>on</strong>g>.7 = F<str<strong>on</strong>g>10</str<strong>on</strong>g>.7avg = 70, Ap = 0),<br />
mean (F<str<strong>on</strong>g>10</str<strong>on</strong>g>.7 = F<str<strong>on</strong>g>10</str<strong>on</strong>g>.7avg = 140, Ap = 15), and high (F<str<strong>on</strong>g>10</str<strong>on</strong>g>.7 = F<str<strong>on</strong>g>10</str<strong>on</strong>g>.7avg = 250, Ap = 300) solar and geomagnetic activities<br />
............................................................................................................................................................................................ 117<br />
Figure G.4: Variati<strong>on</strong> of the NRLMSISE-00 mean c<strong>on</strong>centrati<strong>on</strong> profile of the atmosphere c<strong>on</strong>stituents N2, O, O2, He,<br />
Ar, H, N and anomalous O with altitude for mean solar and geomagnetic activities (F<str<strong>on</strong>g>10</str<strong>on</strong>g>.7 = F<str<strong>on</strong>g>10</str<strong>on</strong>g>.7avg = 140, Ap = 15)117<br />
Figure H.1 Profile of electr<strong>on</strong> density for solar magnetic local time = 18hr, solar magnetic latitude=0, Kp =0 and 9 from<br />
the GCPM for 1/1/1999...................................................................................................................................................... 125<br />
Figure I.1: C<strong>on</strong>tour plots of the electr<strong>on</strong> and prot<strong>on</strong> radiati<strong>on</strong> belts................................................................................. 137<br />
Figure I.2: Electr<strong>on</strong> (a) and prot<strong>on</strong> (b) omnidirecti<strong>on</strong>al fluxes, integral in energy, <strong>on</strong> the geomagnetic equator for<br />
various energy thresholds................................................................................................................................................... 138<br />
Figure I.3: Integral omnidirecti<strong>on</strong>al fluxes of prot<strong>on</strong>s (><str<strong>on</strong>g>10</str<strong>on</strong>g> MeV) and electr<strong>on</strong>s (><str<strong>on</strong>g>10</str<strong>on</strong>g> MeV) at 400 km altitude showing<br />
the inner radiati<strong>on</strong> belt’s “South Atlantic anomaly” and, in the case of electr<strong>on</strong>s, the outer radiati<strong>on</strong> belt encountered at<br />
high latitudes ...................................................................................................................................................................... 139<br />
Figure I.4: Comparis<strong>on</strong> of POLE with AE8 (flux vs. Energy) for 15 year missi<strong>on</strong> (with worst case and best case<br />
included) ............................................................................................................................................................................. 140<br />
Figure I.5: Comparis<strong>on</strong> of ONERA/GNSS model from 0,28 MeV up to 1,12 MeV (best case, mean case and worst case)<br />
with AE8 (flux vs. Energy) for 15 yr missi<strong>on</strong> (with worst case & best case) .................................................................. 140<br />
Figure I.6: Albedo neutr<strong>on</strong> spectra at <str<strong>on</strong>g>10</str<strong>on</strong>g>0 km altitude at solar maximum........................................................................ 141<br />
Figure I.7: Albedo neutr<strong>on</strong> spectra at <str<strong>on</strong>g>10</str<strong>on</strong>g>0 km altitude at solar minimum ........................................................................ 141<br />
Figure I.8: Jupiter envir<strong>on</strong>ment model (prot<strong>on</strong> & electr<strong>on</strong> versi<strong>on</strong>s) ............................................................................... 142<br />
Figure J.1: Time evoluti<strong>on</strong> of the number of trackable objects in orbit (as of October 1 st , 2007)................................... 152<br />
Figure J.2: Semi-major axis distributi<strong>on</strong> of trackable objects in LEO orbits (as of October 1 st , 2007)........................... 152<br />
Figure J.3: Distributi<strong>on</strong> of trackable objects as functi<strong>on</strong> of their inclinati<strong>on</strong> (as of October 1 st , 2007)........................... 153<br />
Tables<br />
Table 6.1: C<strong>on</strong>versi<strong>on</strong> from Kp to ap ................................................................................................................................... 35<br />
Table 6.2: Electromagnetic radiati<strong>on</strong> values ....................................................................................................................... 35<br />
Table 6.3: Reference fixed index values.............................................................................................................................. 36<br />
Table 6.4: Reference index values for short term variati<strong>on</strong> ................................................................................................ 36<br />
Table 8.1: Worst-case bi-Maxwellian envir<strong>on</strong>ment ............................................................................................................ 45<br />
Table 8.2: Solar wind parameters ........................................................................................................................................ 45<br />
Table 9.1: Standard field models to be used with AE8 and AP8........................................................................................ 52<br />
Table <str<strong>on</strong>g>10</str<strong>on</strong>g>.1: Safety factors for impact fluxes........................................................................................................................ 58<br />
Table A.1: Estimates of 13-m<strong>on</strong>th smoothed F<str<strong>on</strong>g>10</str<strong>on</strong>g>.7 values for the <strong>on</strong>e complete solar cycle ........................................... 62<br />
Table B.1: Minima and maxima of sunspot number cycles................................................................................................ 70<br />
Table B.2: IGE 2006 GEO average model – electr<strong>on</strong> flux (kev -1 cm -2 s -1 sr -1 ) according to year in the solar cycle (referred<br />
to solar min: 0) and for different energies ........................................................................................................................... 71<br />
Table B.3: IGE 2006 GEO upper case model - maximum electr<strong>on</strong> flux (kev -1 cm -2 s -1 sr -1 ) according to year in the solar<br />
cycle (referred to solar min: 0) and for different energies .................................................................................................. 72<br />
Table B.4: Worst case spectrum for geostati<strong>on</strong>ary orbits ................................................................................................... 73<br />
Table B.5: Values of the parameters for the ESP model..................................................................................................... 73<br />
Table B.6: Values to scale fluence from ><str<strong>on</strong>g>10</str<strong>on</strong>g>0 MeV to >300 MeV .................................................................................... 73<br />
Table B.7: CREME-96 solar i<strong>on</strong> worst 5-minute fluxes in an interplanetary envir<strong>on</strong>ment............................................... 74


