Electrical - usaid
Electrical - usaid
Electrical - usaid

Create successful ePaper yourself
Turn your PDF publications into a flip-book with our unique Google optimized e-Paper software.
Executive Summary<br />
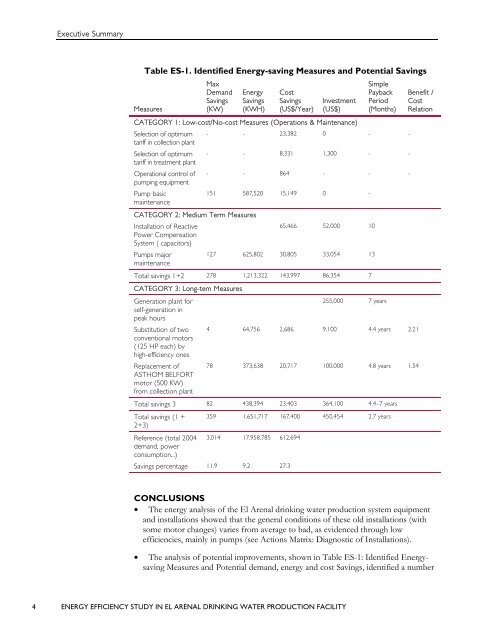
Table ES-1. Identified Energy-saving Measures and Potential Savings<br />
Max<br />
Simple<br />
Demand Energy Cost<br />
Payback Benefit /<br />
Savings Savings Savings Investment Period Cost<br />
Measures<br />
(KW) (KWH) (US$/Year) (US$) (Months) Relation<br />
CATEGORY 1: Low-cost/No-cost Measures (Operations & Maintenance)<br />
Selection of optimum<br />
tariff in collection plant<br />
- - 23,382 0 - -<br />
Selection of optimum<br />
tariff in treatment plant<br />
- - 8,331 1,300 - -<br />
Operational control of<br />
pumping equipment<br />
- - 864 - - -<br />
Pump basic<br />
maintenance<br />
151 587,520 15,149 0 -<br />
CATEGORY 2: Medium Term Measures<br />
Installation of Reactive<br />
Power Compensation<br />
System ( capacitors)<br />
65,466 52,000 10<br />
Pumps major<br />
maintenance<br />
127 625,802 30,805 33,054 13<br />
Total savings 1+2 278 1,213,322 143,997 86,354 7<br />
CATEGORY 3: Long-tem Measures<br />
Generation plant for<br />
self-generation in<br />
peak hours<br />
Substitution of two<br />
conventional motors<br />
(125 HP each) by<br />
high-efficiency ones<br />
Replacement of<br />
ASTHOM BELFORT<br />
motor (500 KW)<br />
from collection plant<br />
4 ENERGY EFFICIENCY STUDY IN EL ARENAL DRINKING WATER PRODUCTION FACILITY<br />
255,000 7 years<br />
4 64,756 2,686 9,100 4.4 years 2.21<br />
78 373,638 20,717 100,000 4.8 years 1.54<br />
Total savings 3 82 438,394 23,403 364,100 4.4–7 years<br />
Total savings (1 +<br />
2+3)<br />
359 1,651,717 167,400 450,454 2.7 years<br />
Reference (total 2004<br />
demand, power<br />
consumption...)<br />
3,014 17,958,785 612,694<br />
Savings percentage 11.9 9.2 27.3<br />
CONCLUSIONS<br />
• The energy analysis of the El Arenal drinking water production system equipment<br />
and installations showed that the general conditions of these old installations (with<br />
some motor changes) varies from average to bad, as evidenced through low<br />
efficiencies, mainly in pumps (see Actions Matrix: Diagnostic of Installations).<br />
• The analysis of potential improvements, shown in Table ES-1: Identified Energysaving<br />
Measures and Potential demand, energy and cost Savings, identified a number