CoreModels - Maryland Virtual High School - Montgomery Blair High ...
CoreModels - Maryland Virtual High School - Montgomery Blair High ...
CoreModels - Maryland Virtual High School - Montgomery Blair High ...
- No tags were found...

Create successful ePaper yourself
Turn your PDF publications into a flip-book with our unique Google optimized e-Paper software.
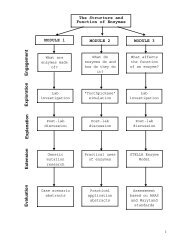
<strong>CoreModels</strong>Enzyme Model—CatalaseA CORE LEARNING GOALS ACTIVITY FOR SCIENCE AND MATHEMATICSSummaryStudents use a computer and a preconstructed STELLA®model of enzyme activity to study the reaction rate of theenzyme catalase. They simulate the effects of variables on theenzyme catalysis rate, substrate amount and reaction productamounts. The variables are temperature, pH, amount ofenzyme, and amount of substrate.Text AuthorsDon ShafferNorth East <strong>High</strong> <strong>School</strong>North East, <strong>Maryland</strong>Susan Ragan<strong>Maryland</strong> <strong>Virtual</strong> <strong>High</strong> <strong>School</strong><strong>Montgomery</strong> <strong>Blair</strong> <strong>High</strong> <strong>School</strong>Silver Spring, <strong>Maryland</strong>Model AuthorRick HeupelCatalina Foothills <strong>School</strong> DistrictTucson, ArizonaCo-AuthorsGeorge Morse, Kevin Wallace,Aline Novak, Janet HartloveLast modified: September 2000This material is based onwork supported by theNational ScienceFoundation. Any opinions,findings, conclusions, orrecommendations expressedon these pages are thoseof the <strong>CoreModels</strong> Projectof the <strong>Maryland</strong> <strong>Virtual</strong><strong>High</strong> <strong>School</strong> of Science andMathematics and do notnecessarily reflect theviews of the NationalScience Foundation.<strong>Maryland</strong> <strong>Virtual</strong> <strong>High</strong> <strong>School</strong>http://mvhs.mbhs.edu51 University Blvd. East cm@mvhs1.mbhs.eduSilver Spring, MD 20901 301-649-2880
Enzyme Model—CatalaseContentsTeacher Guide—ExplanationOverlookActivity Parts at a GlancePrior KnowledgeTeaching TipsExtensionsTeacher Guide—AnswersPart A. Graphing the reactionPart B. Changing the temperaturePart C. Changing the pHPart D. Changing the enzyme concentrationPart E. Changing the substrate concentrationPart F. Interpreting the graphsGraphs for Parts B, C, D, and EE1 – E3E1E1E1E2E2 - E3T1 – T9T1T3T4T4T5T7T8 – T9AppendixesAppendix A Enzyme Model—CatalaseAppendix B Graphs of Initial Model RunAppendix C Model EquationsA1 – A6A1A2A3 - A4
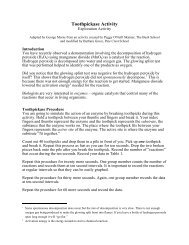
OVERLOOKEnzyme Model—CatalaseTeacher Guide—ExplanationStudents work with a preconstructed STELLA® model (Appendixes A, B, and C)to simulate changes in the catalytic reaction rate of the enzyme catalase. Theychange the value of the experimental variables, one variable at a time. Thevariables are temperature, pH, amount of enzyme, and amount of substrate.With each run of the model, STELLA® generates graphs showing effects of thatvariable on the enzyme catalysis rate, amount of substrate, and amounts ofreaction products.Interpreting the graphs and the model is the essence of the activity. You mayuse Generic Graph Questions (Appendix D) and <strong>CoreModels</strong> GraphInterpretation Guidelines (Appendix E) for students who need help. AppendixC has the STELLA® equations, for students who are interested in how the modelworks.The model is based on the action of catalase, which converts hydrogenperoxide to water and oxygen.The original model from the Creative LearningExchange has been modified for this activity. The <strong>Maryland</strong> <strong>Virtual</strong> <strong>High</strong><strong>School</strong> model version can be found at the MVHS web site.ACTIVITY PARTS AT A GLANCEPart Title Estimated MinutesA Graphing the reaction 15B Changing the temperature 15C Changing the pH 10D Changing the enzyme concentration 10E Changing the substrate concentration 10F Interpreting the graphs 15PRIOR KNOWLEDGEComputer knowledge: Students with no computer skills can do this activity,but may require an explanation of the STELLA® application before they start.Variables: Students should know the difference between control variables andexperimental variables. They should have some experience using the scientificmethod of investigation, testing variables one at a time.Enzymes: Students should be familiar with enzymes and their action andshould understand catalysis. This activity works best when used just after a labsession on enzymes, especially one featuring catalase, where students havemeasured enzyme catalysis rates.Graphs: Students should be able to read and interpret graphs. You might doPart A as a demonstration with class discussion if your students need graphreadinginstruction.pH: Students should know what pH represents.E1
Times 10: Students may need a review of scientific notation and the meaningof “factor of 10.”TEACHING TIPSReview: A quick review of enzymes and catalysis at the start of the activitycould reinforce what students have learned in lab sessions and what they willlearn in the computer activity.Color: Because students will be sketching many curves on the blank graphs,they may want to use colored pencils to make each curve a different color, justas the curves are in the model.Choosing values: In Part B, Changing the temperature, students shouldchoose eight to ten new values, some higher and others lower than the initialtemperature. Students may need guidance in selecting temperatures. Theycould start at 10, for example, and generate curves for 15, 20 (the initialvalue), 25, 30, 35, 40, and so on.Values, again: In Part C, Changing the pH, students should choose severalnew values , some higher and others lower than the initial pH. Students mayuse a specific interval for changing the pH, like 0.2 or 0.3.Enlarging the graph: In Part D, Changing the enzyme concentration,students may need to enlarge the H2O2 to Water graph to see that the ratedoubles when the enzyme amount doubles. Students may want to enlargegraphs for many of the variable changes.Longer simulation: In Part E, Changing the substrate concentration, you maywant to have students extend the length of model simulation for increasedsubstrate from 10 minutes to 50 minutes to see that the reaction finally stopsas the substrate is exhausted.Trouble spots: Possible problems as students work with the model:• They forget to copy the curves STELLA® generates.• They forget to label each curve.• They “mess up” their graphs and need new blank graph pages.• They fail to change the variables systematically.• They decide to investigate the model layer and inadvertently change themodel.EXTENSIONSOther enzymes, such as pepsin, can be investigated with the STELLA® model.Human health requires properly functioning enzymes. Students could reporton diseases such as PKU and Tay-Sachs, which are caused by enzymemalfunction.A safe food supply depends, in part, on control of enzymes in fruits andvegetables. Students could explain how food storage conditions delay ripeningof apples, pears, potatoes and other common edibles.E2
Extreme environments contain creatures that tolerate very high or lowtemperatures, very acidic or alkaline surroundings, very wet or dry conditions.How do their enzymes do it?Acid rain changes the environment. How do organisms react to declining pH?Genetic engineering techniques use high-temperature enzymes. Why?Animal metabolism slows at low temperatures. What happens to enzymes insuch conditions?The model’s mathematics and enzyme kinematics may interest advancedstudents.E3
Enzyme Model—CatalaseTeacher Guide—AnswersCatalysts accelerate chemical reactions that otherwise proceed slowly. Theenzyme called catalase is a catalyst. It exists in plant and animal cells andbreaks down hydrogen peroxide, H2O2, which is a byproduct of metabolism.Hydrogen peroxide is toxic if it accumulates in a cell.The chemical reaction accelerated by catalase is written2(H 2 O 2 ) catalase 2H 2 O + O 2Under favorable conditions, the reaction occurs very fast. The maximumcatalytic rate for one catalase molecule is 6 million molecules of hydrogenperoxide converted to water and oxygen per minute. The reaction product is 6million molecules of water and 3 million molecules of oxygen. (Because theoxygen molecule consists of two oxygen atoms, the number of oxygen moleculesmade in the reaction is half the number of water molecules.)Part A. Graphing the reactionCatalase, like most enzymes, is sensitive to the conditions in which it operates.The main factors that influence enzyme-catalyzed reactions are temperature,pH, enzyme concentration, and substrate concentration. In this activity, youwill simulate how the enzyme catalysis rate (the rate of hydrogen peroxideconversion) changes as these factors change. The changes are shown in graphsgenerated by a preconstructed model (see Appendix A) made with theSTELLA® application and adapted from a model on the Creative LearningExchange web site.• Open the file called Enzyme.stm to launch the STELLA® application. Youwill see four blank graphs and four sliders.When you run the model, each graph will show a dependent variable plottedas a function of time. Time is the independent variable in this activity and isset in minutes. The model has been arranged so the graphs will show:Hydrogen peroxide (expressed as number of molecules) versus timeWater (number of molecules) vs. timeOxygen (number of molecules) vs. timeH2O2 to water rate (number of hydrogen peroxide molecules convertedper minute, which is equal to the number of water molecules producedper minute) vs. time1. Record the initial amount of each dependent variable, shown above eachgraph. Be sure to record the units of measure.Amount of hydrogen peroxide 100,000,000 moleculesAmount of water 0 molecule sAmount of oxygen 0 moleculesH2O2 to water rate 27,000,000 water molecules per minuteT1
The sliders represent factors that can influence the enzyme catalysis rate.2. Record the initial value on each factor’s slider and indicate what itmeasures.Hydrogen peroxide exponent (amount of substrate) 8 (for 10 8pH 7.0 (neutral)Temperature 20 degrees CelsiusAvailable Enzyme 5 moleculesmolecules)In laboratory work, you may have measured enzyme catalysis rates in differentways. In this computer activity, you will use the STELLA® model to changefactors individually, simulating their effect on the enzyme catalysis rate.Run the model at its initial settings.On the four temperature-effect graphs, sketch the curves that STELLA®generates. Label each curve with the initial temperature setting. SeeAppendix B.3. What does the shape of each curve indicate about the change in thatvariable over the simulated 10 minutes of enzyme activity?3a. Hydrogen Peroxide3b. Water3c. OxygenThe hydrogen peroxide curve decreases rapidly, thenlevels off, indicating that most of the hydrogen peroxidemolecules have been broken down when the simulation ishalfway through.The water curve increases rapidly, then levels off,indicating that most of the water molecules have beencreated by about halfway through the simulation.The oxygen curve increases half as rapidly as the watercurve (or, to only half the height of the water curve).Then it levels off, indicating that most of the oxygenmolecules are created by about halfway through thesimulation.3d. H2O2 to Water RateThe curve starts high and stays level (steady) for aquarter of the simulation. It decreases steeply for thenext quarter, then levels out. The shape indicates thatthe reaction is steady for the first quarter of the modelrun, then slows to a near stop by the end of thesimulation.T2
4. Why do you think the curves show no change after about 5 minutes?The curves show no change because the model reactionruns out of substrate.Part B. Changing the temperatureTemperature affects nearly all chemical reaction rates. Rising temperatureincreases enzyme reactions rates until, at high temperatures, enzymes fail towork. Some of the chemical bonds of the enzyme give way and the enzyme’sthree-dimensional structure begins to come apart, that is, the enzymedenatures.In this part of the activity, you will choose different temperatures for thereaction so you can simulate how the enzyme catalysis rate, amount ofsubstrate, and amounts of reaction products change. You will also find theoptimum temperature range for catalase to operate.• Use the Temperature slider to select temperature, or click the numberbox and type your values.• Run the model after each change.• As STELLA® generates each set of curves for each temperature, sketch thecurves on the temperature-effect graphs at the end of the activity. Notethat STELLA® uses a different color for each model run.• Label each curve with the temperature you selected for that model run.5. According to the graphs of temperature effect, how do the variables changeas temperature changes?At temperatures between about 15 °C and 45 °C, theamount of hydrogen peroxide decreases rapidly, thenlevels off, and the most water and oxygen molecules areproduced.6. What is the optimum temperature range for catalase to break downhydrogen peroxide?The exact optimum temperature range is 20 to 35 °C,inclusive. Students should see a difference in the curvesbelow 20 degrees and above 40 degrees.7. What relationship between temperature and enzyme catalysis rate does theH2O2 to Water graph show?At temperatures above or below the optimum range, theenzyme catalysis rate is lower.T3
Part C. Changing the pHAcidity and alkalinity are measured as pH. The pH of the cellular environmentgreatly affects the ability of catalase to break down hydrogen peroxide. In thispart of the activity, you will run the model through a range of pH settings tosimulate how changes in pH affect the enzyme catalysis rate, amount ofsubstrate, and amounts of reaction products. You will also find the optimumpH range for catalase to operate.• Pull down the Map menu and choose Restore, then choose All Devices.The graphs will become blank and the sliders will return to their initialvalue.• Run the model with the initial settings to generate curves forcomparison.• Use the pH slider to change the pH value, or click the number box andtype your values.• Choose several new values.• Run the model after each change.• As STELLA® generates each set of curves for each pH, sketch the curves onthe pH-effect graphs at the end of the activity. Label each curve with thepH you selected for that model run.8. What is the optimum pH range for catalase to break down hydrogenperoxide?The optimum pH range is 6.5 to 7.5, inclusive.9. What relationship between pH and enzyme catalysis rate does the H2O2 toWater graph show?At pH values above or below the optimum range, theenzyme catalysis rate is lower. At very high or very lowpH values, the reaction does not proceed.Part D. Changing the enzyme concentrationThe amount of enzyme available to process the substrate can control anenzyme catalytic reaction. In this part of the activity, you will use theAvailable Enzyme slider to simulate how doubling the amount of enzymeaffects the enzyme catalysis rate, amount of substrate, and amounts ofreaction products.Use Restore All Devices.Run the model with the initial settings.10. What effect do you think doubling the amount of catalase will have on theenzyme catalysis rate?Doubling the amount of catalase should double the rate.T4
• Use the slider to double the available enzyme value, or click the numberbox and type your values. Double the value once, then increase the valueby a small number, like 4 or 5, so you can see changes in the graphs.• Run the model after each change.• As STELLA® generates curves for each value increase, sketch the curves onthe available-enzyme graphs at the end of the activity. Label each curvewith the available enzyme value you selected for that model run.11. What relationship between the amount of catalase and the enzymecatalysis rate does the H2O2 to Water graph show?The more catalase available, the higher the enzymecatalysis rate, up to a certain amount of enzyme.(Students will probably need to enlarge the H2O2 toWater graph to see the rate change.) Between 15 and 20molecules of catalase, all the available hydrogenperoxide designated by the model is instantly converted,so the enzyme catalysis rate decreases immediately.12. Why do you think the enzyme catalysis rate declines rapidly?The rate declines rapidly because there are not enoughsubstrate molecules in the model for more than about 15enzyme molecules. When catalase runs out of hydrogenperoxide to convert (that is, when the 100 millionmolecules supplied by the model are gone), the reactionstops.Part E. Changing the substrate concentrationThe amount of substrate can control an enzyme catalytic reaction. In themodel the amount of substrate is set by the hydrogen peroxide exponent. Achange of 1 in the hydrogen peroxide exponent value changes the amount ofsubstrate by a factor of 10.In this part of the activity, you will change the value of the hydrogen peroxideexponent to simulate how changing the amount of substrate affects theenzyme catalysis rate, amount of enzyme, and amounts of reaction products.• Use Restore All Devices.• Run the model with the initial settings.T5
13. What effect do you think changing the amount of hydrogen peroxide by afactor of 10 will have on the enzyme catalysis rate?Decreasing the amount of hydrogen peroxide shoulddecrease the rate. Increasing the amount should increasethe rate.• Use the slider to decrease the hydrogen peroxide exponent value to 7, orclick the number box and type your value.• Run the model.• As STELLA® generates curves for the new exponent value, sketch them onthe substrate-amount graphs at the end of the activity. Label each curveHydrogen Peroxide Exponent 7.• Change the exponent value to 9, run the model, and sketch and label thecurves that STELLA® generates.14. What relationship between the amount of hydrogen peroxide and theenzyme catalysis rate does the H2O2 to Water graph show?The graph shows that, under initial conditions (10 8molecules), the rate is steady for about 2.5 minutesbefore it starts to decline. When the substrate amountdecreases by a factor of 10 (to 10 7 molecules), the ratestarts lower and declines very quickly. When the amountof substrate increases by a factor of 10 (to 10 9molecules), the reaction rate remains steady for at least10 minutes (length of model simulation).15. Why do you think the enzyme catalysis rate curves have the shape you seein the H2O2 to Water graph?When the number of hydrogen peroxide molecules in themodel is decreased from 100 million to 10 million andthe number of enzyme molecules remains at 5, thereaction starts at a lower rate and soon stops(approaches zero) because the enzyme very quicklyconverts all available substrate. When the number ofhydrogen peroxide molecules is increased from 100million to 1 billion, the enzyme catalysis rate starts atits maximum and stays there because the substrate is inoversupply with respect to the enzyme.T6
Part F. Interpreting the graphsSimulating an enzyme catalytic reaction with a computer model allows you tochange one variable while holding the others constant.Look at the sets of graphs you have sketched for all the changes of the fourvariables. Questions 16 through 20 ask you to interpret the graphs.16. How can you tell from the graphs what the optimum conditions are foreach variable in this simulation?At optimum conditions, the hydrogen peroxide amountdecreases rapidly to almost zero. Water and oxygenmolecules are produced most rapidly. Enzyme catalysisrate is at its highest value.17. What are the most favorable conditions for catalase to break downhydrogen peroxide?Catalase works best between 22 and 35 °C, with pH 6.5 to7.5 (around neutral), and just enough catalase moleculesto break down the supply of hydrogen peroxidemolecules.18. How do the curves for hydrogen peroxide and water compare?The curves are mirror images. For every molecule ofhydrogen peroxide that disappears, a molecule of waterappears.19. How do the graphs for water and oxygen compare?The curves are the same shape, but oxygen’s are half theheight of water’s. Half as many oxygen molecules form inthe reaction as water molecules.20. How do you think the catalase reaction simulated by the STELLA® modelcompares with the reaction in living organisms?In the model, for most of the variables’ values, nearly allthe hydrogen peroxide molecules are used up, so thereaction stops. In living organisms, the cells are alwaysmaking hydrogen peroxide, so the reaction keeps going.T7
Graphs of Values for Parts B, C, D and EEffects of Temperature, pH, Available Enzyme and SubstrateConcentrationPart B. Effect of temperature on enzyme reactions ratesHydrogen PeroxideOxygenWaterH2O2 to WaterPart C. Effect of pH on enzyme reactions ratesHydrogen PeroxideOxygenWaterH2O2 to WaterT8
Graphs of Values for Parts B, C, D and E (cont.)Effects of Temperature, pH, Available Enzyme and SubstrateConcentration (cont.)Part D. Effect of available enzyme on enzyme reactions ratesHydrogen PeroxideOxygenWaterH2O2 to WaterPart E. Effect of substrate amount on enzyme reactions ratesHydrogen PeroxideOxygenWaterH2O2 to WaterT9
Appendix AEnzyme Model—CatalaseThe chemical reaction accelerated by catalase is written2(H 2 O 2 ) catalase 2H 2 O + O 2Initial values of each dependent variable:Amount of hydrogen peroxide 100,000,000 moleculesAmount of water 0 moleculesAmount of oxygen 0 moleculesH2O2 to water rate 27,000,000 water molecules per minuteInitial values of each influencing factor’s slider:Hydrogen peroxide exponent (amount of substrate) 8pH 7.0 (neutral)Temperature 20 degrees CelsiusAvailable Enzyme 5 moleculesA1
Appendix BEnzyme Model—Initial RunHydrogen Peroxide | 6131Oxygen | 49,996,934Graph: Hydrogen PeroxideGraph: OxygenWater | 99,993,869H 2O 2 to Water | 8175Graph: WaterGraph: H2O2 to WaterEach graph shows a dependent variable plotted as a function of time.Time is the independent variable in this activity and is set in minutes.The model has been arranged so that the graphs will show:Hydrogen peroxide (expressed as number of molecules) versus timeWater (number of molecules) vs. timeOxygen (number of molecules) vs. timeH2O2 to Water rate vs. timeThe enzyme catalysis rate (H2O2 to Water) is the number of hydrogen peroxidemolecules converted per minute, which is equal to the number of water moleculesproduced per minute.A2
Appendix CEnzyme Model—STELLA® EquationsHydrogen_Peroxide(t) = Hydrogen_Peroxide(t-dt)+(- H2O2_Catalysis_Rate) * dtINIT Hydrogen_Peroxide = 1*10^(Hydrogen_Peroxide_Exponent)DOCUMENT: The amount of hydrogen peroxide in this stock is number ofmolecules and not absolute concentration (M). The value is set at more thanthe maximum catalytic rate of catalase at its optimal temperature and pH,which is 6 million H2O2 molecules (see H2O2 Catalysis Rate and H2O2 to Waterflows).OUTFLOWS:H2O2_Catalysis_Rate(o) =min(Enzyme_Rate*Available_Enzyme,Hydrogen_Peroxide)DOCUMENT: The enzyme catalysis rate equals the minimum of the amountof hydrogen peroxide and the catalase catalytic rate multiplied by theamount of available enzyme. Because two molecules of hydrogen peroxideare converted into two molecules of water and one molecule of oxygen (O2),this model uses a conversion multiplier to halve the amount of oxygenaccumulated per catalytic event. (See H2O2 Catalysis Rate (i).)Oxygen(t) = Oxygen(t - dt) + (H2O2_Catalysis_Rate) * dtINIT Oxygen = 0DOCUMENT: The number of oxygen molecules created is one-half the numberof hydrogen peroxide molecules that break down in the reaction. Therefore, themodel uses a conversion multiplier to halve the amount of oxygenaccumulated per catalytic event.INFLOWS:H2O2_Catalysis_Rate(i) = H2O2_Catalysis_Rate(o) * CONVERSIONMULTIPLIERCONVERSION MULTIPLIER = 0.5DOCUMENT: The enzyme catalysis rate equals the minimum of the catalasecatalytic rate multiplied by the amount of available enzyme and theamount of hydrogen peroxide. Because two molecules of hydrogen peroxideare converted into two molecules of water and one molecule of oxygen (O2),this model uses a conversion multiplier to halve the amount of oxygenaccumulated per catalytic event. (See H2O2 Catalysis Rate (i).)Water(t) = Water(t - dt) + (H2O2_to_Water) * dtINIT Water = 0DOCUMENT: The water measured here is metabolic water, water that isproduced from the conversion of hydrogen peroxide by catalase.INFLOWS:H2O2_to_Water = H2O2_Catalysis_RateDOCUMENT: This model "measures" metabolic water because that numberof molecules is equal to the number of H2O2 molecules converted; so H2O2to Water is set to equal H2O2 Catalysis Rate catalysis without a conversionmultiplier.A3
Appendix C (cont.)Enzyme Model—STELLA® EquationsAvailable_Enzyme = 5DOCUMENT: Amount is number of molecules of catalase.Enzyme_Rate = 6e6 * pH_Effect*Temperature_EffectDOCUMENT: The catalytic rate of catalase (the number of molecules ofsubstrate converted per enzyme molecule per minute) is affected by both thepH and the temperature of the reaction. Each factor has an optimal value.Hydrogen_Peroxide_Exponent = 8DOCUMENT: This convertor sets the exponent for the number of hydrogenperoxide molecules in the stock and is used in the slider that controls initialhydrogen peroxide amount.pH = 7.0Temperature = 20DOCUMENT: Temperature is in degrees Celsius.pH_Effect = GRAPH(pH)(0.00, 0.00), (1.08, 0.00), (2.15, 0.00), (3.23, 0.00), (4.31, 0.2), (5.38, 0.8), (6.46,1.00), (7.54, 1.00), (8.62, 0.8), (9.69, 0.2), (10.8, 0.00), (11.8, 0.00), (12.9, 0.00),(14.0, 0.00)DOCUMENT: This model uses a standard bell-shaped curve of the effect of pHon catalase catalysis rate. The curve has a maximum at pH 7.0 and drops tozero at pH 4.0 and near pH 11.0. This curve can be described by an algebraicequation using simple Michalis-Menton theory where Vmax (pH)= [Eo] (kcatpH). See Fersht's Enzyme Structure and Mechanism.Temperature_Effect = GRAPH(Temperature)(0.00, 0.01), (7.14, 0.1), (14.3, 0.5), (21.4, 1.00), (28.6, 1.00), (35.7, 1.00), (42.9,0.9), (50.0, 0.5), (57.1, 0.005), (64.3, 0.00), (71.4, 0.00), (78.6, 0.00), (85.7,0.00), (92.9, 0.00), (100.0, 0.00)DOCUMENT: Using data from Lehninger's Biochemistry in the model, weassume that catalase operates at its maximum rate from 20 to 37 degrees Cand is denatured at about 60 degrees.A4