National Drug Strategy 2006-2009 - part 1 - posted 18/08/06 - Alcohol
National Drug Strategy 2006-2009 - part 1 - posted 18/08/06 - Alcohol
National Drug Strategy 2006-2009 - part 1 - posted 18/08/06 - Alcohol

Create successful ePaper yourself
Turn your PDF publications into a flip-book with our unique Google optimized e-Paper software.
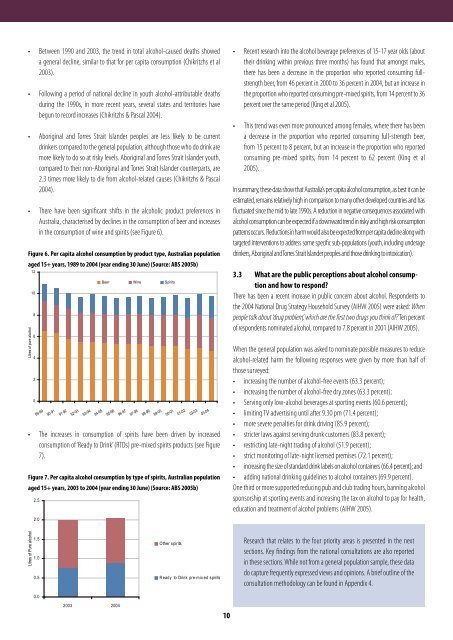
• Between 1990 and 2003, the trend in total alcohol-caused deaths showeda general decline, similar to that for per capita consumption (Chikritzhs et al2003).• Following a period of national decline in youth alcohol-attributable deathsduring the 1990s, in more recent years, several states and territories havebegun to record increases (Chikritzhs & Pascal 2004).• Aboriginal and Torres Strait Islander peoples are less likely to be currentdrinkers compared to the general population, although those who do drink aremore likely to do so at risky levels. Aboriginal and Torres Strait Islander youth,compared to their non-Aboriginal and Torres Strait Islander counter<strong>part</strong>s, are2.3 times more likely to die from alcohol-related causes (Chikritzhs & Pascal2004).• There have been significant shifts in the alcoholic product preferences inAustralia, characterised by declines in the consumption of beer and increasesin the consumption of wine and spirits (see Figure 6).Figure 6. Per capita alcohol consumption by product type, Australian populationaged 15+ years, 1989 to 2004 (year ending 30 June) (Source: ABS 2005b)• The increases in consumption of spirits have been driven by increasedconsumption of ‘Ready to Drink’ (RTDs) pre-mixed spirits products (see Figure7).Figure 7. Per capita alcohol consumption by type of spirits, Australian populationaged 15+ years, 2003 to 2004 (year ending 30 June) (Source: ABS 2005b)• Recent research into the alcohol beverage preferences of 15-17 year olds (abouttheir drinking within previous three months) has found that amongst males,there has been a decrease in the proportion who reported consuming fullstrengthbeer, from 46 percent in 2000 to 36 percent in 2004, but an increase inthe proportion who reported consuming pre-mixed spirits, from 14 percent to 36percent over the same period (King et al 2005).• This trend was even more pronounced among females, where there has beena decrease in the proportion who reported consuming full-strength beer,from 15 percent to 8 percent, but an increase in the proportion who reportedconsuming pre-mixed spirits, from 14 percent to 62 percent (King et al2005).In summary, these data show that Australia’s per capita alcohol consumption, as best it can beestimated, remains relatively high in comparison to many other developed countries and hasfluctuated since the mid to late 1990s. A reduction in negative consequences associated withalcohol consumption can be expected if a downward trend in risky and high risk consumptionpatterns occurs. Reductions in harm would also be expected from per capita decline along withtargeted interventions to address some specific sub-populations (youth, including underagedrinkers, Aboriginal and Torres Strait Islander peoples and those drinking to intoxication).3.3 What are the public perceptions about alcohol consumptionand how to respond?There has been a recent increase in public concern about alcohol. Respondents tothe 2004 <strong>National</strong> <strong>Drug</strong> <strong>Strategy</strong> Household Survey (AIHW 2005) were asked: Whenpeople talk about ‘drug problem’, which are the first two drugs you think of? Ten percentof respondents nominated alcohol, compared to 7.8 percent in 2001 (AIHW 2005).When the general population was asked to nominate possible measures to reducealcohol-related harm the following responses were given by more than half ofthose surveyed:• increasing the number of alcohol-free events (63.3 percent);• increasing the number of alcohol-free dry zones (63.3 percent);• Serving only low-alcohol beverages at sporting events (60.6 percent);• limiting TV advertising until after 9.30 pm (71.4 percent);• more severe penalties for drink driving (85.9 percent);• stricter laws against serving drunk customers (83.8 percent);• restricting late-night trading of alcohol (51.9 percent);• strict monitoring of late-night licensed premises (72.1 percent);• increasing the size of standard drink labels on alcohol containers (66.4 percent); and• adding national drinking guidelines to alcohol containers (69.9 percent).One third or more supported reducing pub and club trading hours, banning alcoholsponsorship at sporting events and increasing the tax on alcohol to pay for health,education and treatment of alcohol problems (AIHW 2005).Research that relates to the four priority areas is presented in the nextsections. Key findings from the national consultations are also reportedin these sections. While not from a general population sample, these datado capture frequently expressed views and opinions. A brief outline of theconsultation methodology can be found in Appendix 4.10