Assessment of Health System Performance in Nepal - Ministerial ...
Assessment of Health System Performance in Nepal - Ministerial ...
Assessment of Health System Performance in Nepal - Ministerial ...

Create successful ePaper yourself
Turn your PDF publications into a flip-book with our unique Google optimized e-Paper software.
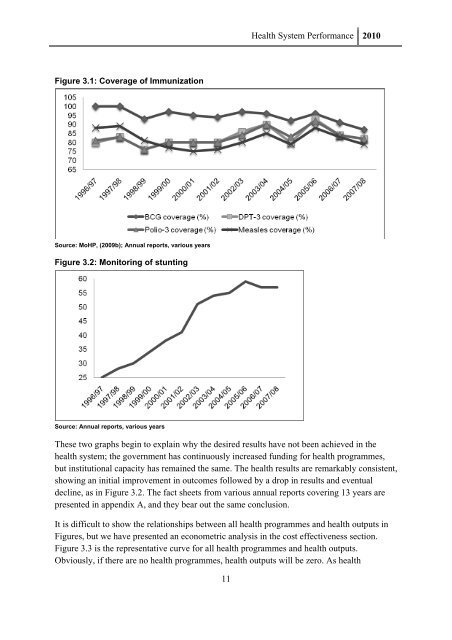
<strong>Health</strong> <strong>System</strong> <strong>Performance</strong> 2010Figure 3.1: Coverage <strong>of</strong> ImmunizationSource: MoHP, (2009b); Annual reports, various yearsFigure 3.2: Monitor<strong>in</strong>g <strong>of</strong> stunt<strong>in</strong>gSource: Annual reports, various yearsThese two graphs beg<strong>in</strong> to expla<strong>in</strong> why the desired results have not been achieved <strong>in</strong> thehealth system; the government has cont<strong>in</strong>uously <strong>in</strong>creased fund<strong>in</strong>g for health programmes,but <strong>in</strong>stitutional capacity has rema<strong>in</strong>ed the same. The health results are remarkably consistent,show<strong>in</strong>g an <strong>in</strong>itial improvement <strong>in</strong> outcomes followed by a drop <strong>in</strong> results and eventualdecl<strong>in</strong>e, as <strong>in</strong> Figure 3.2. The fact sheets from various annual reports cover<strong>in</strong>g 13 years arepresented <strong>in</strong> appendix A, and they bear out the same conclusion.It is difficult to show the relationships between all health programmes and health outputs <strong>in</strong>Figures, but we have presented an econometric analysis <strong>in</strong> the cost effectiveness section.Figure 3.3 is the representative curve for all health programmes and health outputs.Obviously, if there are no health programmes, health outputs will be zero. As health11