Invesco Funds Series 5 Interim Report - Invesco Global Product Range
Invesco Funds Series 5 Interim Report - Invesco Global Product Range
Invesco Funds Series 5 Interim Report - Invesco Global Product Range

Create successful ePaper yourself
Turn your PDF publications into a flip-book with our unique Google optimized e-Paper software.
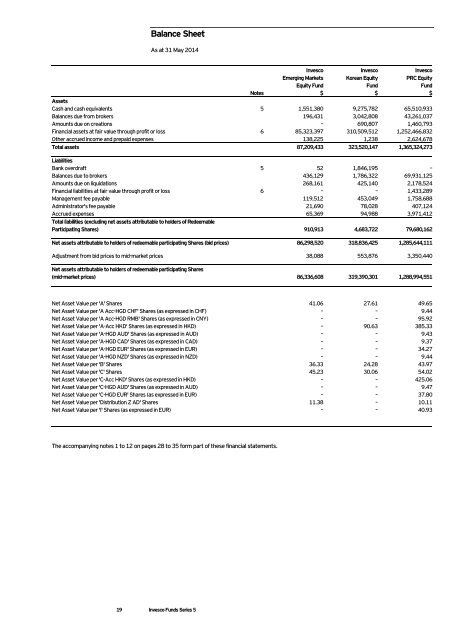
Balance SheetAs at 31 May 2014<strong>Invesco</strong>Emerging MarketsEquity Fund<strong>Invesco</strong>Korean EquityFund<strong>Invesco</strong>PRC EquityFundNotes $ $ $AssetsCash and cash equivalents 5 1,551,380 9,275,782 65,510,933Balances due from brokers 196,431 3,042,808 43,261,037Amounts due on creations – 690,807 1,460,793Financial assets at fair value through profit or loss 6 85,323,397 310,509,512 1,252,466,832Other accrued income and prepaid expenses 138,225 1,238 2,624,678Total assets 87,209,433 323,520,147 1,365,324,273LiabilitiesBank overdraft 5 52 1,846,195 –Balances due to brokers 436,129 1,786,322 69,931,125Amounts due on liquidations 268,161 425,140 2,178,524Financial liabilities at fair value through profit or loss 6 – – 1,433,289Management fee payable 119,512 453,049 1,758,688Administrator's fee payable 21,690 78,028 407,124Accrued expenses 65,369 94,988 3,971,412Total liabilities (excluding net assets attributable to holders of RedeemableParticipating Shares) 910,913 4,683,722 79,680,162Net assets attributable to holders of redeemable participating Shares (bid prices) 86,298,520 318,836,425 1,285,644,111Adjustment from bid prices to mid-market prices 38,088 553,876 3,350,440Net assets attributable to holders of redeemable participating Shares(mid-market prices) 86,336,608 319,390,301 1,288,994,551Net Asset Value per 'A' Shares 41.06 27.61 49.65Net Asset Value per 'A Acc-HGD CHF' Shares (as expressed in CHF) – – 9.44Net Asset Value per 'A Acc-HGD RMB' Shares (as expressed in CNY) – – 95.92Net Asset Value per 'A-Acc HKD' Shares (as expressed in HKD) – 90.63 385.33Net Asset Value per 'A-HGD AUD' Shares (as expressed in AUD) – – 9.43Net Asset Value per 'A-HGD CAD' Shares (as expressed in CAD) – – 9.37Net Asset Value per 'A-HGD EUR' Shares (as expressed in EUR) – – 34.27Net Asset Value per 'A-HGD NZD' Shares (as expressed in NZD) – – 9.44Net Asset Value per 'B' Shares 36.33 24.28 43.97Net Asset Value per 'C' Shares 45.23 30.06 54.02Net Asset Value per 'C-Acc HKD' Shares (as expressed in HKD) – – 425.06Net Asset Value per 'C-HGD AUD' Shares (as expressed in AUD) – – 9.47Net Asset Value per 'C-HGD EUR' Shares (as expressed in EUR) – – 37.80Net Asset Value per 'Distribution Z AD' Shares 11.38 – 10.11Net Asset Value per 'I' Shares (as expressed in EUR) – – 40.93The accompanying notes 1 to 12 on pages 28 to 35 form part of these financial statements.19 <strong>Invesco</strong> <strong>Funds</strong> <strong>Series</strong> 5