OVK Online- RepORt 2011/ 01
OVK Online- RepORt 2011/ 01
OVK Online- RepORt 2011/ 01

You also want an ePaper? Increase the reach of your titles
YUMPU automatically turns print PDFs into web optimized ePapers that Google loves.
llion<br />
MOnthly tREnD In GROSS ADVERtISInG InVEStMEnt tOP 10 OnlInE ADVERtISInG FORMAtS<br />
Advertisers turn<br />
increasingly to<br />
conventional online<br />
advertising.<br />
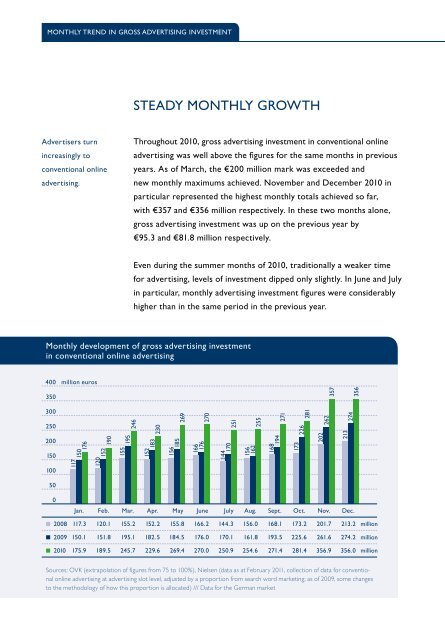
StEADy MOnthly GROWth<br />
throughout 2<strong>01</strong>0, gross advertising investment in conventional online<br />
advertising was well above the figures for the same months in previous<br />
years. As of March, the €200 million mark was exceeded and<br />
new monthly maximums achieved. november and December 2<strong>01</strong>0 in<br />
particular represented the highest monthly totals achieved so far,<br />
with €357 and €356 million respectively. In these two months alone,<br />
gross advertising investment was up on the previous year by<br />
€95.3 and €81.8 million respectively.<br />
Even during the summer months of 2<strong>01</strong>0, traditionally a weaker time<br />
for advertising, levels of investment dipped only slightly. In June and July<br />
in particular, monthly advertising investment figures were considerably<br />
higher than in the same period in the previous year.<br />
Monthly development of gross advertising investment<br />
in conventional online advertising<br />
400<br />
350<br />
300<br />
250<br />
200<br />
150<br />
100<br />
50<br />
million euros<br />
117<br />
150<br />
176<br />
120<br />
152<br />
190<br />
155 195 246<br />
152 183 230<br />
156 185<br />
269<br />
166<br />
176<br />
270<br />
0<br />
Jan. Feb. Mar. Apr. May June July Aug. Sept. Oct. nov. Dec.<br />
■ 2008 117.3 120.1 155.2 152.2 155.8 166.2 144.3 156.0 168.1 173.2 2<strong>01</strong>.7 213.2 million<br />
■ 2009 150.1 151.8 195.1 182.5 184.5 176.0 170.1 161.8 193.5 225.6 261.6 274.2 million<br />
■ 2<strong>01</strong>0 175.9 189.5 245.7 229.6 269.4 270.0 250.9 254.6 271.4 281.4 356.9 356.0 million<br />
Sources: <strong>OVK</strong> (extrapolation of figures from 75 to 100%), Nielsen (data as at February <strong>2<strong>01</strong>1</strong>, collection of data for conventional<br />
online advertising at advertising slot level, adjusted by a proportion from search word marketing; as of 2009, some changes<br />
to the methodology of how this proportion is allocated) /// Data for the German market<br />
144 170<br />
251<br />
156<br />
162<br />
255<br />
168 194<br />
271<br />
173<br />
226<br />
281<br />
202<br />
262<br />
357<br />
213<br />
274<br />
356<br />
lARGE-SCAlE AnD IntEGRAtED<br />
ADVERtISInG FORMAtS COntInuE tO<br />
GAIn GROunD<br />
A look at the top 10 advertising formats in terms of absolute gross<br />
advertising investment in 2<strong>01</strong>0 reveals the continued high demand for<br />
large-scale and integrated standard forms of advertising – an indicator<br />
of the increased branding orientation of online advertising. Eye-catching<br />
formats, such as wallpaper, leaderboards and rectangles, occupy the<br />
top three places, followed by the classic formats skyscraper, medium<br />
rectangle and microsite.<br />
the maxi ad has also seen spending increases – thanks to the establish-<br />
ment of the <strong>OVK</strong> Premium Ad Package amongst all market partners<br />
– and exhibited the third strongest rate of growth after pre-roll and<br />
wallpaper. the pre-roll once again experienced the largest increase<br />
amongst all advertising formats examined, highlighting the unwaning<br />
popularity of moving image adverts.<br />
top 10 advertising formats in terms of gross advertising<br />
investment for whole of 2<strong>01</strong>0<br />
Wallpaper<br />
leaderboard<br />
Rectangle<br />
Skyscraper<br />
Medium rectangle<br />
Microsite<br />
Maxi ad<br />
Pop-under<br />
Pre-Roll<br />
tandem in-page ad<br />
52.3<br />
45.0<br />
34.2<br />
81.2<br />
74.4<br />
188.9<br />
169.6<br />
152.8<br />
9<br />
the innovative new<br />
advertising media enable<br />
very complex advertising<br />
messages to be<br />
conveyed thanks to their<br />
generous presentation<br />
area and multimedia<br />
options.<br />
0 50 100 150 200 250 300<br />
■ Values in million euros<br />
Source: Nielsen (data as at February <strong>2<strong>01</strong>1</strong>) /// Not all marketers provide reports with a complete breakdown of the<br />
information. Due to the partial lack of detail, the individual reports have been summarised. /// Basis: includes the online<br />
marketers allesklar media, BAUER MEDIA, G+J Electronic Media Sales, IP Deutschland, iq digital media marketing;<br />
MAIRDUMONT MEDIA, Microsoft Advertising, netpoint media, OMS, SevenOne Media, SPIEGEL QC, TOMORROW<br />
FOCUS, United Internet Media and Yahoo! Deutschland /// Data for the German market<br />
125.9<br />
250.3