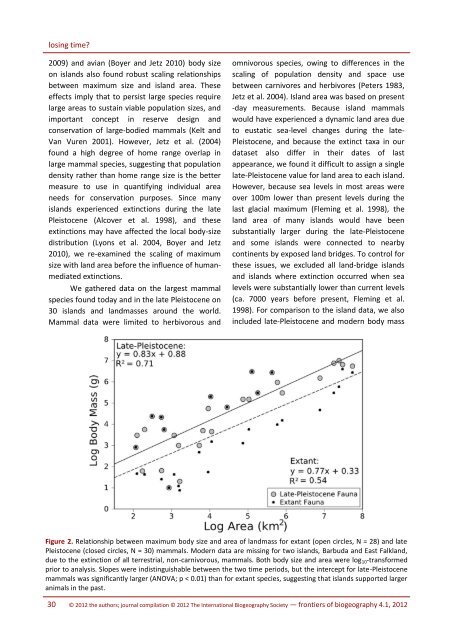
losing time?2009) and avian (Boyer and Jetz 2010) body sizeon islands also found robust scaling relationshipsbetween maximum size and island area. <strong>The</strong>seeffects imply that to persist large species requirelarge areas to sustain viable population sizes, andimportant concept in reserve design andconservation of large-bodied mammals (Kelt andVan Vuren 2001). However, Jetz et al. (2004)found a high degree of home range overlap inlarge mammal species, suggesting that populationdensity rather than home range size is the bettermeasure to use in quantifying individual areaneeds for conservation purposes. Since manyislands experienced extinctions during the latePleistocene (Alcover et al. 1998), and theseextinctions may have affected the local body-sizedistribution (Lyons et al. 2004, Boyer and Jetz2010), we re-examined the scaling of maximumsize with land area before the influence of humanmediatedextinctions.We gathered data on the largest mammalspecies found today and in the late Pleistocene on30 islands and landmasses around the world.Mammal data were limited to herbivorous andomnivorous species, owing to differences in thescaling of population density and space usebetween carnivores and herbivores (Peters 1983,Jetz et al. 2004). Island area was based on present-day measurements. Because island mammalswould have experienced a dynamic land area dueto eustatic sea-level changes during the late-Pleistocene, and because the extinct taxa in ourdataset also differ in their dates of lastappearance, we found it difficult to assign a singlelate-Pleistocene value for land area to each island.However, because sea levels in most areas wereover 100m lower than present levels during thelast glacial maximum (Fleming et al. 1998), theland area of many islands would have beensubstantially larger during the late-Pleistoceneand some islands were connected to nearbycontinents by exposed land bridges. To control forthese issues, we excluded all land-bridge islandsand islands where extinction occurred when sealevels were substantially lower than current levels(ca. 7000 years before present, Fleming et al.1998). For comparison to the island data, we alsoincluded late-Pleistocene and modern body massFigure 2. Relationship between maximum body size and area of landmass for extant (open circles, N = 28) and latePleistocene (closed circles, N = 30) mammals. Modern data are missing for two islands, Barbuda and East Falkland,due to the extinction of all terrestrial, non-carnivorous, mammals. Both body size and area were log 10 -transformedprior to analysis. Slopes were indistinguishable between the two time periods, but the intercept for late-Pleistocenemammals was significantly larger (ANOVA; p < 0.01) than for extant species, suggesting that islands supported largeranimals in the past.30 © 2012 the authors; journal compilation © 2012 <strong>The</strong> <strong>International</strong> <strong>Biogeography</strong> <strong>Society</strong> — frontiers of biogeography 4.1, 2012
Felisa A. Smith and Alison G. Boyervalues and modern land area for six continentallandmasses (Australia, New Guinea, SouthAmerica, North America, Africa, and Eurasia).Body size (g) and area (km²) were log 10 -transformed prior to analysis. We compared thesize of the largest mammal species on each islandbefore and after the extinction, and plotted thesebody size maxima against land area (Fig. 2).<strong>The</strong> strength and direction of the scalingbetween maximum body size and area in extantspecies was not significantly altered by theinclusion of extinct species, but the intercept wassignificantly higher when late-Pleistocene specieswere included (ANOVA, P < 0.01, df=1,54, F=7.4)than for extant species (Fig. 2). This translates toan order of magnitude decrease in the size of thelargest mammal supported by a given land areasince the late Pleistocene. For example, accordingto the modern data, the largest mammal that anisland of 1000 km 2 would be expected to supportis about 431g, however, in the late-Pleistocenefauna, this maximum size was 2291g.In order to compare the scaling of body sizewith area to other studies, we computed the slopeof the relationship with body mass as theindependent variable (late-Pleistocene: slope =0.86, extant: slope = 0.71). Late-Pleistocenefaunas were statistically consistent with previousstudies of both the scaling of maximum body sizewith area in extinction-structured communities(slope = 0.79, Marquet and Taper 1998) and thebody-size scaling of population density inmammals (slope = 0.76, Jetz et al. 2004),suggesting that late-Pleistocene island faunasaccurately represent the ecologically constrainedscaling of maximum body size with area. It isbeyond the scope of this study to determine theecological mechanisms that allowed larger speciesto inhabit smaller areas in the past than thatobserved today; differences in scaling interceptmay relate to the allocation of land area andresurces for use by humans and their commensals(Boyer and Jetz 2010). However, it is clear thatmacroecological studies based solely on extantspecies, especially those conducted in areasknown to be affected by recent extinctions, mayoffer an incomplete picture of these ecosystems.Temporal perspective in conservation studiesA central goal of conservation biology is tounderstand the extinction process in order tomitigate current and future anthropogenicbiodiversity losses. Extinction risk analyses, likemany other predictive ecological studies, areoften based on current distributions of extantspecies (Cardillo 2003, Jones et al. 2003). Longertemporal records, however, can provide analternative perspective on how conservationistsview extinctions. From this perspective, near-timefossil data can be invaluable for identifyinggeneral patterns of extinction risk (McKinney1997, Willis et al. 2007, Boyer 2010). <strong>The</strong> inclusionof fossil data has several advantages: unlike dataon extant endangered species, fossil data providedirect information on the extinction process itself.Rarity and extinction do not always result fromthe same processes. Second, fossil data representan independent dataset of extinction probabilityon which to build predictive models. This avoidsthe circularity inherent in building a model andtesting it on the same dataset (such as the IUCNRed List). Not only can paleoecological dataprovide a comparison of prehistoric (>500 years)and historic (past 500 years) extinctions, but suchdata may also aid in determining baselineconditions for conservation and restoration, andhelp predict future extinction risk.As a conservation-oriented case study, weturn to the Holocene extinction of birds on Pacificislands. In the Hawaiian islands, the arrival ofPolynesian colonists about 1200 years agocorresponded with the extinction of about 50% ofindigenous land bird species (56/111 species;Olson and James 1982, 1991). In comparison,historic losses of Hawaiian birds amount to about40% of the historically observed species (23/55species; Boyer 2008). To put global Holoceneavian extinctions in context, Pimm et al. (2006)estimated extinction rates for pre-European andhistoric timescales, and compared these to thegeneric background of ~1 extinction per millionspecies per year (E/MSY). Historic rates werearound 26 E/MSY, but after accounting for pre-European extinctions, the estimate rose to ~100E/MSY. <strong>The</strong> vast majority of recorded extinctionsfrontiers of biogeography 4.1, 2012 — © 2012 the authors; journal compilation © 2012 <strong>The</strong> <strong>International</strong> <strong>Biogeography</strong> <strong>Society</strong>31