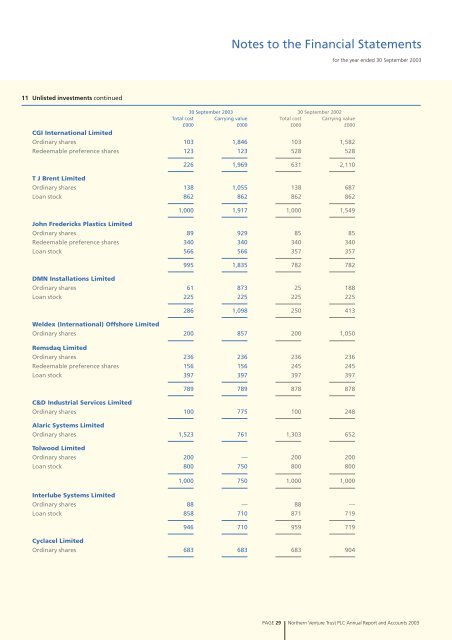
Notes to the Financial Statementsfor the year ended 30 September 20039 Earnings/(loss) per shareThe earnings/(loss) per share is based on the profit on ordinary activities after tax of £920,000 (2002 £150,000) <strong>and</strong>on 40,271,179 (2002 41,008,605) shares, being the weighted average number of shares in issue during the year.30 September 2003 30 September 200210 Fixed asset investments £000 £000Venture capital investments – unlisted 22,359 24,184– listed 4,867 2,981Other listed investments 3,750 6,24530,976 33,410Movements in investments during the year are summarised as follows:Venture capital Venture capital Other listed– unlisted – listed investments Total£000 £000 £000 £000Book cost at 1 October 2002 25,973 3,672 8,091 37,736Unrealised appreciation at 1 October 2002 (1,789) (691) (1,846) (4,326)Valuation at 1 October 2002 24,184 2,981 6,245 33,410Movements in the year:Purchases at cost 2,347 331 385 3,063Disposals – proceeds (4,527) (1,261) (3,377) (9,165)– net realised (losses)/gains (113) 676 90 653Increase in unrealised appreciation 468 2,140 407 3,015Valuation at 30 September 2003 22,359 4,867 3,750 30,976Comprising:Book cost at 30 September 2003 22,112 3,279 4,783 30,174Unrealised appreciation at 30 September 2003 247 1,588 (1,033) 80222,359 4,867 3,750 30,976At 30 September 2003 there were commitments totalling £562,000 (30 September 2002 £177,000) in respect ofinvestments approved by the board but not completed.11 Unlisted investmentsThe cost <strong>and</strong> carrying value of material investments in unlisted companies held at 30 September 2003 are shownbelow. For this purpose, any unlisted investment included in the table of the fifteen largest venture capitalinvestments on pages 11 to 15, or in the corresponding table in the previous year’s annual <strong>report</strong>, is regarded asmaterial.30 September 2003 30 September 2002Total cost Carrying value Total cost Carrying value£000 £000 £000 £000TFB Group LimitedOrdinary shares 167 1,299 167 167Loan stock 833 833 833 8331,000 2,132 1,000 1,000PAGE 28 Northern Venture Trust PLC <strong>Annual</strong> Report <strong>and</strong> Accounts 2003
Notes to the Financial Statementsfor the year ended 30 September 200311 Unlisted investments continued30 September 2003 30 September 2002Total cost Carrying value Total cost Carrying value£000 £000 £000 £000CGI International LimitedOrdinary shares 103 1,846 103 1,582Redeemable preference shares 123 123 528 528226 1,969 631 2,110T J Brent LimitedOrdinary shares 138 1,055 138 687Loan stock 862 862 862 8621,000 1,917 1,000 1,549John Fredericks Plastics LimitedOrdinary shares 89 929 85 85Redeemable preference shares 340 340 340 340Loan stock 566 566 357 357995 1,835 782 782DMN Installations LimitedOrdinary shares 61 873 25 188Loan stock 225 225 225 225286 1,098 250 413Weldex (International) Offshore LimitedOrdinary shares 200 857 200 1,050Remsdaq LimitedOrdinary shares 236 236 236 236Redeemable preference shares 156 156 245 245Loan stock 397 397 397 397789 789 878 878C&D Industrial Services LimitedOrdinary shares 100 775 100 248Alaric Systems LimitedOrdinary shares 1,523 761 1,303 652Tolwood LimitedOrdinary shares 200 — 200 200Loan stock 800 750 800 8001,000 750 1,000 1,000Interlube Systems LimitedOrdinary shares 88 — 88 —Loan stock 858 710 871 719946 710 959 719Cyclacel LimitedOrdinary shares 683 683 683 904PAGE 29 29 Northern Venture Trust PLC <strong>Annual</strong> Report <strong>and</strong> Accounts 2003