BSC 2010 Annual Report.pdf - Brunswick Secondary College
BSC 2010 Annual Report.pdf - Brunswick Secondary College
BSC 2010 Annual Report.pdf - Brunswick Secondary College
- No tags were found...
You also want an ePaper? Increase the reach of your titles
YUMPU automatically turns print PDFs into web optimized ePapers that Google loves.
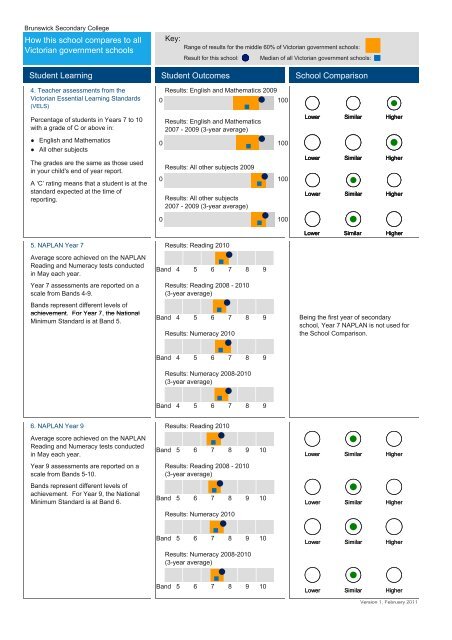
<strong>Brunswick</strong> <strong>Secondary</strong> <strong>College</strong>How this school compares to allVictorian government schoolsKey:Range of results for the middle 60% of Victorian government schools:Result for this school: Median of all Victorian government schools:Student Learning Student Outcomes School Comparison4. Teacher assessments from theVictorian Essential Learning Standards(VELS)Percentage of students in Years 7 to 10with a grade of C or above in:● English and Mathematics● All other subjectsThe grades are the same as those usedin your child's end of year report.A ‘C’ rating means that a student is at thestandard expected at the time ofreporting.000Results: English and Mathematics 2009Results: English and Mathematics2007 - 2009 (3-year average)Results: All other subjects 2009Results: All other subjects2007 - 2009 (3-year average)100100100Lower Similar HigherLower Similar HigherLower Similar Higher01005. NAPLAN Year 7 Results: Reading <strong>2010</strong>Average score achieved on the NAPLANReading and Numeracy tests conductedin May each year.Year 7 assessments are reported on ascale from Bands 4-9.Bands represent different levels ofachievement. For Year 7, the NationalMinimum Standard is at Band 5.Band 4 5 6 7 8 9Results: Reading 2008 - <strong>2010</strong>(3-year average)Band 4 5 6 7 8 9Results: Numeracy <strong>2010</strong>Lower Similar HigherBeing the first year of secondaryschool, Year 7 NAPLAN is not used forthe School Comparison.Band 4 5 6 7 8 9Results: Numeracy 2008-<strong>2010</strong>(3-year average)Band 4 5 6 7 8 96. NAPLAN Year 9 Results: Reading <strong>2010</strong>Average score achieved on the NAPLANReading and Numeracy tests conductedin May each year.Year 9 assessments are reported on ascale from Bands 5-10.Bands represent different levels ofachievement. For Year 9, the NationalMinimum Standard is at Band 6.Band 5 6 7 8 9 10Results: Reading 2008 - <strong>2010</strong>(3-year average)Band 5 6 7 8 9 10Results: Numeracy <strong>2010</strong>Lower Similar HigherLower Similar HigherBand 5 6 7 8 9 10Results: Numeracy 2008-<strong>2010</strong>(3-year average)Lower Similar HigherBand 5 6 7 8 9 10Lower Similar HigherVersion 1, February 2011


