Nielsen 2012-2013 TV Household DMA Ranks
Nielsen 2012-2013 TV Household DMA Ranks
Nielsen 2012-2013 TV Household DMA Ranks

You also want an ePaper? Increase the reach of your titles
YUMPU automatically turns print PDFs into web optimized ePapers that Google loves.
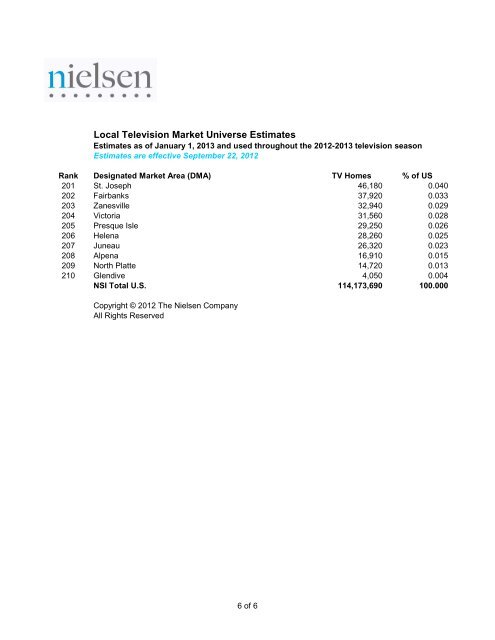
Local Television Market Universe Estimates<br />
Estimates as of January 1, <strong>2013</strong> and used throughout the <strong>2012</strong>-<strong>2013</strong> television season<br />
Estimates are effective September 22, <strong>2012</strong><br />
Rank Designated Market Area (<strong>DMA</strong>) <strong>TV</strong> Homes % of US<br />
201 St. Joseph 46,180 0.040<br />
202 Fairbanks 37,920 0.033<br />
203 Zanesville 32,940 0.029<br />
204 Victoria 31,560 0.028<br />
205 Presque Isle 29,250 0.026<br />
206 Helena 28,260 0.025<br />
207 Juneau 26,320 0.023<br />
208 Alpena 16,910 0.015<br />
209 North Platte 14,720 0.013<br />
210 Glendive 4,050 0.004<br />
NSI Total U.S. 114,173,690 100.000<br />
Copyright © <strong>2012</strong> The <strong>Nielsen</strong> Company<br />
All Rights Reserved<br />
6 of 6