Mequon-Thiensville School District
Mequon-Thiensville School District
Mequon-Thiensville School District
- No tags were found...

Create successful ePaper yourself
Turn your PDF publications into a flip-book with our unique Google optimized e-Paper software.
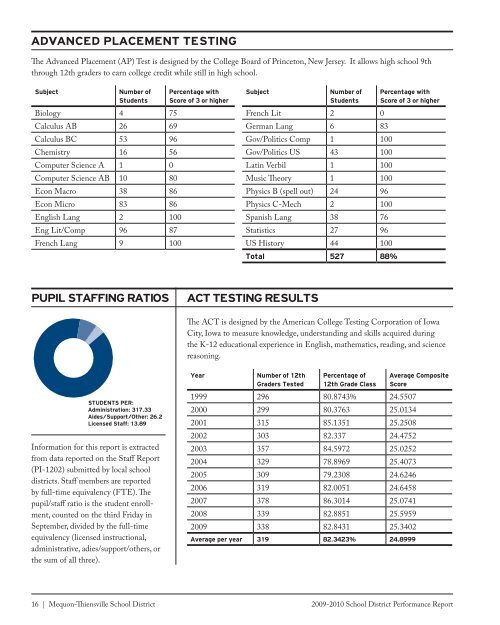
ADVANCED PLACEMENT TESTINGThe Advanced Placement (AP) Test is designed by the College Board of Princeton, New Jersey. It allows high school 9ththrough 12th graders to earn college credit while still in high school.SubjectNumber ofStudentsBiology 4 75Calculus AB 26 69Calculus BC 53 96Chemistry 16 56Computer Science A 1 0Computer Science AB 10 80Econ Macro 38 86Econ Micro 83 86English Lang 2 100Eng Lit/Comp 96 87French Lang 9 100Percentage withScore of 3 or higherSubjectNumber ofStudentsFrench Lit 2 0German Lang 6 83Gov/Politics Comp 1 100Gov/Politics US 43 100Latin Verbil 1 100Music Theory 1 100Physics B (spell out) 24 96Physics C-Mech 2 100Spanish Lang 38 76Statistics 27 96US History 44 100Total 527 88%Percentage withScore of 3 or higherPUPIL STAFFING RATIOSACT TESTING RESULTSThe ACT is designed by the American College Testing Corporation of IowaCity, Iowa to measure knowledge, understanding and skills acquired duringthe K-12 educational experience in English, mathematics, reading, and sciencereasoning.STUDENTS PER:Administration: 317.33Aides/Support/Other: 26.2Licensed Staff: 13.89Information for this report is extractedfrom data reported on the Staff Report(PI-1202) submitted by local schooldistricts. Staff members are reportedby full-time equivalency (FTE). Thepupil/staff ratio is the student enrollment,counted on the third Friday inSeptember, divided by the full-timeequivalency (licensed instructional,administrative, adies/support/others, orthe sum of all three).YearNumber of 12thGraders_ TestedPercentage of12th Grade Class1999 296 80.8743% 24.55072000 299 80.3763 25.01342001 315 85.1351 25.25082002 303 82.337 24.47522003 357 84.5972 25.02522004 329 78.8969 25.40732005 309 79.2308 24.62462006 319 82.0051 24.64582007 378 86.3014 25.07412008 339 82.8851 25.59592009 338 82.8431 25.3402Average per year 319 82.3423% 24.8999Average CompositeScore16 | <strong>Mequon</strong>-<strong>Thiensville</strong> <strong>School</strong> <strong>District</strong> 2009-2010 <strong>School</strong> <strong>District</strong> Performance Report