Table 6: Empirical studies on the relationship between ESG and corporateoperational performance.Study authorsTimeperiodESG Issue ESG Factor impact (*)Albuquerque, Durnev, and Koskinen (2013) 2003-2012 Composite CSR index ESG PositiveAmmann, Oesch, and Schmidt (2011) 2003-2007 Compiled governance indices G Positive (1)Baron, Harjoto, and Jo (2011) 1996-2004Aggregate CSR strengths index and CSRconcerns indexESG Mixed findings (2)Bebchuk and Cohen (2005) 1995-2002 Classified boards (Board structure) G Positive (3)Bebchuk, Cohen, and Wang (2011) 2010 Classified boards G PositiveBeiner, Drobetz, Schmid, and Zimmerman (2006) 2003Composite and individual governanceindicatorsGPositiveBenson and Davidson (2010) 1991-2002Stakeholder management practices andsocial issue participationSPositiveBorgers, Derwall, Koedijk, and ter Horst (2013) 1992-2009 Stakeholder relations index S PositiveBrown and Caylor (2006) 2003 Composite governance score G PositiveBusch and Hoffmann (2011) 2007 Carbon intensity E MixedCai, Jo, and Pan (2012) 1995-2009 Aggregate CSR index ESG Positive (4)Clarkson, Li, and Richardson (2004) 1989-2000 Environmental capital expenditures E Positive (5)Cochran and Wood (1984) 1970-1979 CSR reputation index ESG PositiveCore, Guay, and Rusticus (2006) 1990-1999 Governance index/shareholder rights G Positive (6)Core, Holthausen, and Larcker (1999) 1982-1984 Excess compensation G Positive (7)Cornett, Erhemjamts, and Tehranian (2013) 2003-2011 Overall ESG index ESG No effect (8)Cremers and Ferrell (2013) 1978-2006 Governance index/shareholder rights G Positive (9)Darnall, Henriques, and Sadorsky (2008) 2003Adoption of environmentalmanagement practicesEPositiveDowell, Hart, and Yeung (2000) 1994-1997Adoption of global environmentalstandardsEPositiveFaleye and Trahan (2011) 1998-2005 Good workforce practices S PositiveGarcia-Castro, Arino, and Canela (2010) 1991-2005Aggregate stakeholder relationsmeasureESGNo effectGiroud and Mueller (2010) 1976-1995 Industry concentration G Positive (10)Giroud and Mueller (2011) 1990-2006 Governance index G Positive (11)Guenster, Derwall, Bauer, and Koedijk (2011) 1997-2004 Eco-efficiency levels E PositiveHart and Ahuja (1996) 1989-1992 Reduction in pollution E Positive (12)Hawn and Ioannou (2013) 2002-2008 Symbolic CSR actions ESG PositiveHillman and Keim (2001) 1994-1996Stakeholder relations and social issuesparticipationS Positive (13)Huselid (1995) - Good workforce practices S PositiveJayachandran, Kalaignanam, and Eilert (2013) -Corporate environmental performance,product social performanceES Mixed (14)(continued)30
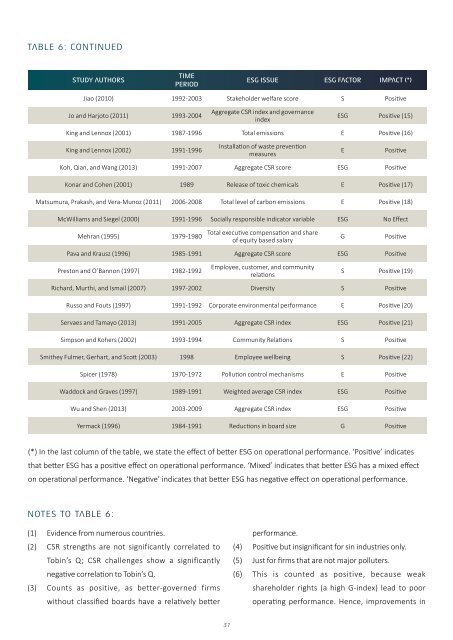
Table 6: continuedStudy authorsTimeperiodesg issue esg factor impact (*)Jiao (2010) 1992-2003 Stakeholder welfare score S PositiveJo and Harjoto (2011) 1993-2004Aggregate CSR index and governanceindexESG Positive (15)King and Lennox (2001) 1987-1996 Total emissions E Positive (16)King and Lennox (2002) 1991-1996Installation of waste preventionmeasuresEPositiveKoh, Qian, and Wang (2013) 1991-2007 Aggregate CSR score ESG PositiveKonar and Cohen (2001) 1989 Release of toxic chemicals E Positive (17)Matsumura, Prakash, and Vera-Munoz (2011) 2006-2008 Total level of carbon emissions E Positive (18)McWilliams and Siegel (2000) 1991-1996 Socially responsible indicator variable ESG No EffectMehran (1995) 1979-1980Total executive compensation and shareof equity based salaryGPositivePava and Krausz (1996) 1985-1991 Aggregate CSR score ESG PositivePreston and O’Bannon (1997) 1982-1992Employee, customer, and communityrelationsS Positive (19)Richard, Murthi, and Ismail (2007) 1997-2002 Diversity S PositiveRusso and Fouts (1997) 1991-1992 Corporate environmental performance E Positive (20)Servaes and Tamayo (2013) 1991-2005 Aggregate CSR index ESG Positive (21)Simpson and Kohers (2002) 1993-1994 Community Relations S PositiveSmithey Fulmer, Gerhart, and Scott (2003) 1998 Employee wellbeing S Positive (22)Spicer (1978) 1970-1972 Pollution control mechanisms E PositiveWaddock and Graves (1997) 1989-1991 Weighted average CSR index ESG PositiveWu and Shen (2013) 2003-2009 Aggregate CSR index ESG PositiveYermack (1996) 1984-1991 Reductions in board size G Positive(*) In the last column of the table, we state the effect of better ESG on operational performance. ‘Positive’ indicatesthat better ESG has a positive effect on operational performance. ‘Mixed’ indicates that better ESG has a mixed effecton operational performance. ‘Negative’ indicates that better ESG has negative effect on operational performance.Notes to Table 6:(1) Evidence from numerous countries.(2) CSR strengths are not significantly correlated toTobin’s Q; CSR challenges show a significantlynegative correlation to Tobin’s Q.(3) Counts as positive, as better-governed firmswithout classified boards have a relatively betterperformance.(4) Positive but insignificant for sin industries only.(5) Just for firms that are not major polluters.(6) This is counted as positive, because weakshareholder rights (a high G-index) lead to pooroperating performance. Hence, improvements in31
- Page 1 and 2: How Sustainability Can Drive Financ
- Page 3 and 4: “The report shows that shareholde
- Page 5 and 6: Contents1. Introduction 82. A Busin
- Page 7 and 8: eport HighlightsSustainability is o
- Page 9 and 10: 2. A Business Casefor CorporateSust
- Page 11 and 12: The materiality of environmental, s
- Page 13 and 14: Neglecting sustainability issues ca
- Page 15 and 16: Case Study: British PetroleumBP’s
- Page 17 and 18: Table 3: Overview of studies on the
- Page 20 and 21: Studies also show that credit ratin
- Page 23 and 24: Table 4: Empirical studies investig
- Page 25 and 26: 4. Sustainabilityand OperationalPer
- Page 27 and 28: firms with staggered or classified
- Page 29: SummaryIn this section, we have ana
- Page 33 and 34: 5. Sustainability andStock PricesTh
- Page 35 and 36: are less ‘eco-efficient’, 149 a
- Page 37 and 38: profile are acquired, the market re
- Page 39 and 40: Table 7: Empirical studies investig
- Page 41 and 42: more sustainable firms remain on th
- Page 43 and 44: To date, active ownership has achie
- Page 45 and 46: This clear economic case for sustai
- Page 47 and 48: Bauer, R., Derwall, J., & Hann, D.
- Page 49 and 50: Coca-Cola Company. (2013). Setting
- Page 51 and 52: European Commission. (2013b). Commi
- Page 53 and 54: Hart, S. L., & Ahuja, G. (1996). Do
- Page 55 and 56: Margolis, J. D., & Walsh, J. P. (20
- Page 57 and 58: Servaes, H., & Tamayo, A. (2013). T