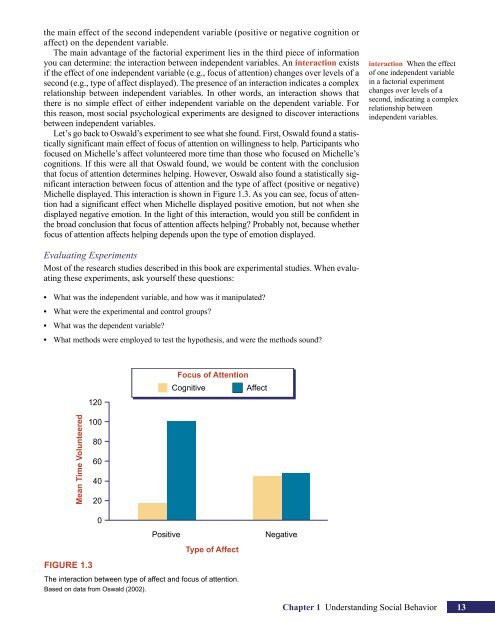
the main effect of the second independent variable (positive or negative cognition oraffect) on the dependent variable.The main advantage of the factorial experiment lies in the third piece of informationyou can determine: the interaction between independent variables. An interaction existsif the effect of one independent variable (e.g., focus of attention) changes over levels of asecond (e.g., type of affect displayed). The presence of an interaction indicates a complexrelationship between independent variables. In other words, an interaction shows thatthere is no simple effect of either independent variable on the dependent variable. Forthis reason, most social psychological experiments are designed to discover interactionsbetween independent variables.Letʼs go back to Oswald’s experiment to see what she found. First, Oswald found a statisticallysignificant main effect of focus of attention on willingness to help. Participants whofocused on Michelle’s affect volunteered more time than those who focused on Michelle’scognitions. If this were all that Oswald found, we would be content with the conclusionthat focus of attention determines helping. However, Oswald also found a statistically significantinteraction between focus of attention and the type of affect (positive or negative)Michelle displayed. This interaction is shown in Figure 1.3. As you can see, focus of attentionhad a significant effect when Michelle displayed positive emotion, but not when shedisplayed negative emotion. In the light of this interaction, would you still be confident inthe broad conclusion that focus of attention affects helping? Probably not, because whetherfocus of attention affects helping depends upon the type of emotion displayed.interaction When the effectof one independent variablein a factorial experimentchanges over levels of asecond, indicating a complexrelationship betweenindependent variables.Evaluating ExperimentsMost of the research studies described in this book are experimental studies. When evaluatingthese experiments, ask yourself these questions:• What was the independent variable, and how was it manipulated?• What were the experimental and control groups?• What was the dependent variable?• What methods were employed to test the hypothesis, and were the methods sound?Focus of AttentionCognitiveAffect120Mean Time Volunteered100806040200PositiveNegativeType of AffectFigure 1.3The interaction between type of affect and focus of attention.Based on data from Oswald (2002).<strong>Chapter</strong> 1 Understanding Social Behavior 13
• Were there any confounding variables that could provide an alternative explanation for theresults?• What was found? That is, what changes in the dependent variable were observed as a functionof manipulation of the independent variable?• What was the nature of the sample used? Was the sample representative of the generalpopulation, or was it limited with respect to demographics, such as age, gender, culture, orsome other set of characteristics?positive correlationThe direction of a correlationin which the values of twovariables increase or decreasein the same direction.negative correlationThe direction of a correlationin which the value of onevariable increases whereas thevalue of a second decreases.correlation coefficientA statistical technique usedto determine the directionand strength of a relationshipbetween two variables.Correlational ResearchAlthough most research in social psychology is experimental, some research is correlational.In correlational research, researchers do not manipulate an independent variable.Instead, they measure two or more dependent variables and look for a relationshipbetween them. If changes in one variable are associated with changes in another, thetwo variables are said to be correlated. When the values of two variables change in thesame direction, increasing or decreasing in value, there is a positive correlation betweenthem. For example, if you find that crime increases along with increases in temperature,a positive correlation exists. When the values change in opposite directions, one increasingand the other decreasing, there is a negative correlation between the variables. Forexample, if you find that less help is given as the number of bystanders to an emergencyincreases, a negative correlation exists. When one variable does not change systematicallywith the other, they are uncorrelated.Even if correlations are found, however, a causal relationship cannot be inferred. Forexample, height and weight are correlated with each other—the greater one is, the greaterthe other tends to be—but increases in one do not cause increases in the other. Changes inboth are caused by other factors, such as growth hormone and diet. Correlational researchindicates whether changes in one variable are related to changes in another, but it doesnot indicate why the changes are related. Cause and effect can be demonstrated only byexperiments.In correlational studies, researchers are interested in both the direction of the relationshipbetween the variables (whether it is positive or negative) and the degree, orstrength, of the relationship. They measure these two factors with a special statisticaltest known as the correlation coefficient (symbolized as r). The size of the correlationcoefficient, which can range from –1 through 0 to +1, shows the degree of the relationship.A value of r that approaches –1 to +1 indicates a stronger relationship than a valuecloser to 0.In Figure 1.4, the five graphs illustrate correlations of varying strengths and directions.Figure 1.4A shows a 0 correlation: Points are scattered at random within thegraph. Figures 1.4B and 1.4C show positive correlations of different strengths. Asthe correlation gets stronger, the points start to line up with each other (Figure 1.4B).In a perfect positive correlation (r = +1), all the points line up along a straight line(Figure 1.4C). Notice that in a positive correlation, the points line up along a line thatslopes in an upward direction, beginning at the lower left of the graph and ending atthe upper right.In a negative correlation (shown in Figures 1.4D and 1.4E), the same rules concerningstrength apply that held for the positive correlation. Figure 1.4E shows a perfect negativecorrelation (–1).An excellent example of a correlational study is one conducted by Del Barrio, Aluja,and Garcia (2004). Del Barrio et al. investigated the relationship between personalitycharacteristics and an individualʼs capacity to feel empathy for someone in need. Del Barrioet al. administered a measure of empathy and a personality inventory measuring the“Big Five” personality dimensions (energy, friendliness, conscientiousness, emotionalstability, and openness) to Spanish adolescents. Del Barrio et al. found that “friendliness”correlated most strongly with empathy for both boys and girls. High scores on the14 Social Psychology