Quantifying the impact of land-use change to European farmland ...
Quantifying the impact of land-use change to European farmland ...
Quantifying the impact of land-use change to European farmland ...

You also want an ePaper? Increase the reach of your titles
YUMPU automatically turns print PDFs into web optimized ePapers that Google loves.
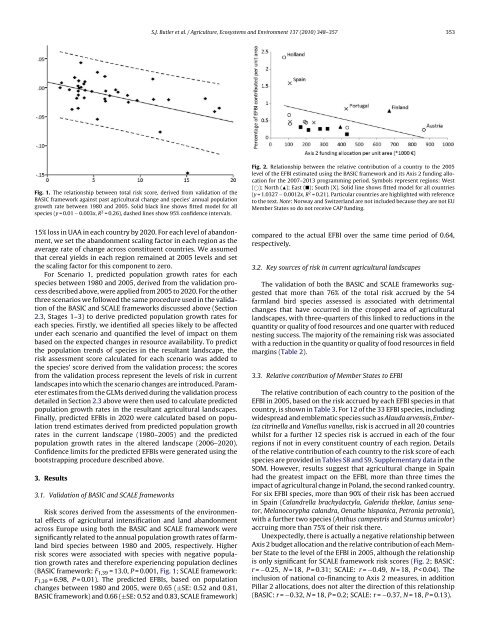
Fig. 1. The relationship between <strong>to</strong>tal risk score, derived from validation <strong>of</strong> <strong>the</strong><br />
BASIC framework against past agricultural <strong>change</strong> and species’ annual population<br />
growth rate between 1980 and 2005. Solid black line shows fitted model for all<br />
species (y = 0.01 − 0.003x, R 2 = 0.26), dashed lines show 95% confidence intervals.<br />
15% loss in UAA in each country by 2020. For each level <strong>of</strong> abandonment,<br />
we set <strong>the</strong> abandonment scaling fac<strong>to</strong>r in each region as <strong>the</strong><br />
average rate <strong>of</strong> <strong>change</strong> across constituent countries. We assumed<br />
that cereal yields in each region remained at 2005 levels and set<br />
<strong>the</strong> scaling fac<strong>to</strong>r for this component <strong>to</strong> zero.<br />
For Scenario 1, predicted population growth rates for each<br />
species between 1980 and 2005, derived from <strong>the</strong> validation process<br />
described above, were applied from 2005 <strong>to</strong> 2020. For <strong>the</strong> o<strong>the</strong>r<br />
three scenarios we followed <strong>the</strong> same procedure <strong>use</strong>d in <strong>the</strong> validation<br />
<strong>of</strong> <strong>the</strong> BASIC and SCALE frameworks discussed above (Section<br />
2.3, Stages 1–3) <strong>to</strong> derive predicted population growth rates for<br />
each species. Firstly, we identified all species likely <strong>to</strong> be affected<br />
under each scenario and quantified <strong>the</strong> level <strong>of</strong> <strong>impact</strong> on <strong>the</strong>m<br />
based on <strong>the</strong> expected <strong>change</strong>s in resource availability. To predict<br />
<strong>the</strong> population trends <strong>of</strong> species in <strong>the</strong> resultant <strong>land</strong>scape, <strong>the</strong><br />
risk assessment score calculated for each scenario was added <strong>to</strong><br />
<strong>the</strong> species’ score derived from <strong>the</strong> validation process; <strong>the</strong> scores<br />
from <strong>the</strong> validation process represent <strong>the</strong> levels <strong>of</strong> risk in current<br />
<strong>land</strong>scapes in<strong>to</strong> which <strong>the</strong> scenario <strong>change</strong>s are introduced. Parameter<br />
estimates from <strong>the</strong> GLMs derived during <strong>the</strong> validation process<br />
detailed in Section 2.3 above were <strong>the</strong>n <strong>use</strong>d <strong>to</strong> calculate predicted<br />
population growth rates in <strong>the</strong> resultant agricultural <strong>land</strong>scapes.<br />
Finally, predicted EFBIs in 2020 were calculated based on population<br />
trend estimates derived from predicted population growth<br />
rates in <strong>the</strong> current <strong>land</strong>scape (1980–2005) and <strong>the</strong> predicted<br />
population growth rates in <strong>the</strong> altered <strong>land</strong>scape (2006–2020).<br />
Confidence limits for <strong>the</strong> predicted EFBIs were generated using <strong>the</strong><br />
bootstrapping procedure described above.<br />
3. Results<br />
3.1. Validation <strong>of</strong> BASIC and SCALE frameworks<br />
Risk scores derived from <strong>the</strong> assessments <strong>of</strong> <strong>the</strong> environmental<br />
effects <strong>of</strong> agricultural intensification and <strong>land</strong> abandonment<br />
across Europe using both <strong>the</strong> BASIC and SCALE framework were<br />
significantly related <strong>to</strong> <strong>the</strong> annual population growth rates <strong>of</strong> farm<strong>land</strong><br />
bird species between 1980 and 2005, respectively. Higher<br />
risk scores were associated with species with negative population<br />
growth rates and <strong>the</strong>refore experiencing population declines<br />
(BASIC framework: F 1,39 = 13.0, P = 0.001, Fig. 1; SCALE framework:<br />
F 1,39 = 6.98, P = 0.01). The predicted EFBIs, based on population<br />
<strong>change</strong>s between 1980 and 2005, were 0.65 (±SE: 0.52 and 0.81,<br />
BASIC framework) and 0.66 (±SE: 0.52 and 0.83, SCALE framework)<br />
S.J. Butler et al. / Agriculture, Ecosystems and Environment 137 (2010) 348–357 353<br />
Fig. 2. Relationship between <strong>the</strong> relative contribution <strong>of</strong> a country <strong>to</strong> <strong>the</strong> 2005<br />
level <strong>of</strong> <strong>the</strong> EFBI estimated using <strong>the</strong> BASIC framework and its Axis 2 funding allocation<br />
for <strong>the</strong> 2007–2013 programming period. Symbols represent regions: West<br />
(○); North (�); East (�); South (X). Solid line shows fitted model for all countries<br />
(y = 1.0327 − 0.0012x, R 2 = 0.21). Particular countries are highlighted with reference<br />
<strong>to</strong> <strong>the</strong> text. Note: Norway and Switzer<strong>land</strong> are not included beca<strong>use</strong> <strong>the</strong>y are not EU<br />
Member States so do not receive CAP funding.<br />
compared <strong>to</strong> <strong>the</strong> actual EFBI over <strong>the</strong> same time period <strong>of</strong> 0.64,<br />
respectively.<br />
3.2. Key sources <strong>of</strong> risk in current agricultural <strong>land</strong>scapes<br />
The validation <strong>of</strong> both <strong>the</strong> BASIC and SCALE frameworks suggested<br />
that more than 76% <strong>of</strong> <strong>the</strong> <strong>to</strong>tal risk accrued by <strong>the</strong> 54<br />
farm<strong>land</strong> bird species assessed is associated with detrimental<br />
<strong>change</strong>s that have occurred in <strong>the</strong> cropped area <strong>of</strong> agricultural<br />
<strong>land</strong>scapes, with three-quarters <strong>of</strong> this linked <strong>to</strong> reductions in <strong>the</strong><br />
quantity or quality <strong>of</strong> food resources and one quarter with reduced<br />
nesting success. The majority <strong>of</strong> <strong>the</strong> remaining risk was associated<br />
with a reduction in <strong>the</strong> quantity or quality <strong>of</strong> food resources in field<br />
margins (Table 2).<br />
3.3. Relative contribution <strong>of</strong> Member States <strong>to</strong> EFBI<br />
The relative contribution <strong>of</strong> each country <strong>to</strong> <strong>the</strong> position <strong>of</strong> <strong>the</strong><br />
EFBI in 2005, based on <strong>the</strong> risk accrued by each EFBI species in that<br />
country, is shown in Table 3. For 12 <strong>of</strong> <strong>the</strong> 33 EFBI species, including<br />
widespread and emblematic species such as Alauda arvensis, Emberiza<br />
citrinella and Vanellus vanellus, risk is accrued in all 20 countries<br />
whilst for a fur<strong>the</strong>r 12 species risk is accrued in each <strong>of</strong> <strong>the</strong> four<br />
regions if not in every constituent country <strong>of</strong> each region. Details<br />
<strong>of</strong> <strong>the</strong> relative contribution <strong>of</strong> each country <strong>to</strong> <strong>the</strong> risk score <strong>of</strong> each<br />
species are provided in Tables S8 and S9, Supplementary data in <strong>the</strong><br />
SOM. However, results suggest that agricultural <strong>change</strong> in Spain<br />
had <strong>the</strong> greatest <strong>impact</strong> on <strong>the</strong> EFBI, more than three times <strong>the</strong><br />
<strong>impact</strong> <strong>of</strong> agricultural <strong>change</strong> in Po<strong>land</strong>, <strong>the</strong> second ranked country.<br />
For six EFBI species, more than 90% <strong>of</strong> <strong>the</strong>ir risk has been accrued<br />
in Spain (Ca<strong>land</strong>rella brachydactyla, Galerida <strong>the</strong>klae, Lanius sena<strong>to</strong>r,<br />
Melanocorypha ca<strong>land</strong>ra, Oena<strong>the</strong> hispanica, Petronia petronia),<br />
with a fur<strong>the</strong>r two species (Anthus campestris and Sturnus unicolor)<br />
accruing more than 75% <strong>of</strong> <strong>the</strong>ir risk <strong>the</strong>re.<br />
Unexpectedly, <strong>the</strong>re is actually a negative relationship between<br />
Axis 2 budget allocation and <strong>the</strong> relative contribution <strong>of</strong> each Member<br />
State <strong>to</strong> <strong>the</strong> level <strong>of</strong> <strong>the</strong> EFBI in 2005, although <strong>the</strong> relationship<br />
is only significant for SCALE framework risk scores (Fig. 2; BASIC:<br />
r = −0.25, N = 18, P = 0.31; SCALE: r = −0.49, N = 18, P < 0.04). The<br />
inclusion <strong>of</strong> national co-financing <strong>to</strong> Axis 2 measures, in addition<br />
Pillar 2 allocations, does not alter <strong>the</strong> direction <strong>of</strong> this relationship<br />
(BASIC: r = −0.32, N = 18, P = 0.2; SCALE: r = −0.37, N = 18, P = 0.13).