Annual Report 2012 - Americana Group
Annual Report 2012 - Americana Group
Annual Report 2012 - Americana Group

You also want an ePaper? Increase the reach of your titles
YUMPU automatically turns print PDFs into web optimized ePapers that Google loves.
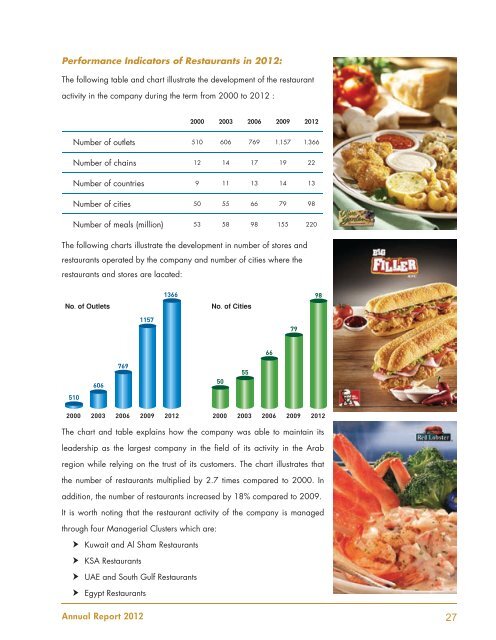
Performance Indicators of Restaurants in <strong>2012</strong>:The following table and chart illustrate the development of the restaurantactivity in the company during the term from 2000 to <strong>2012</strong> :2000 2003 2006 2009 <strong>2012</strong>Number of outlets 510 606 769 1.157 1.366Number of chains 12 14 17 19 22Number of countries 9 11 13 14 13Number of cities 50 55 66 79 98Number of meals (million) 53 58 98 155 220The following charts illustrate the development in number of stores andrestaurants operated by the company and number of cities where therestaurants and stores are lacated:No. of Outlets1366No. of Cities981157796660676950555102000 2003 2006 2009 <strong>2012</strong> 2000 2003 2006 2009 <strong>2012</strong>The chart and table explains how the company was able to maintain itsleadership as the largest company in the field of its activity in the Arabregion while relying on the trust of its customers. The chart illustrates thatthe number of restaurants multiplied by 2.7 times compared to 2000. Inaddition, the number of restaurants increased by 18% compared to 2009.It is worth noting that the restaurant activity of the company is managedthrough four Managerial Clusters which are:Kuwait and Al Sham RestaurantsKSA RestaurantsUAE and South Gulf RestaurantsEgypt Restaurants<strong>Annual</strong> <strong>Report</strong> <strong>2012</strong>27