http://researchspace.auckland.ac.nz ResearchSpace@Auckland ...
http://researchspace.auckland.ac.nz ResearchSpace@Auckland ...
http://researchspace.auckland.ac.nz ResearchSpace@Auckland ...
Create successful ePaper yourself
Turn your PDF publications into a flip-book with our unique Google optimized e-Paper software.
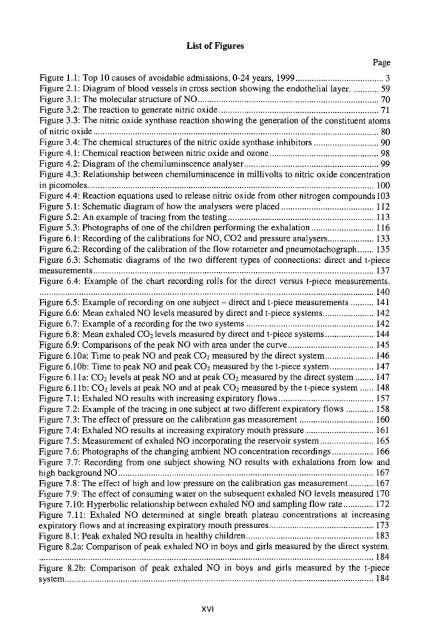
List of Figures<br />
Figure l.l: Top l0 causes of avoidable admissions, 0-24 years, 1999.......... .......... 3<br />
Figure 2.1: Diagram of blood vessels in cross section showing the endothelial layer. ...........59<br />
Figure 3.1: The molecular structure of NO....... ................. 70<br />
Figure 3.2: The re<strong>ac</strong>tion to generate nitric oxide ...............71<br />
Figure 3.3: The nitric oxide synthase re<strong>ac</strong>tion showing the generation of the constituent atoms<br />
of nitric oxide........ ....... 80<br />
Figure 3.4: The chemical structures of the nitric oxide synthase inhibitors ..........90<br />
Figure 4.1: Chemical re<strong>ac</strong>tion between nitric oxide and ozone. .......... 98<br />
Figure 4.2:Diagram of the chemiluminscence analyser.... .................. 99<br />
Figure 4.3: Relationship between chemiluminscence in millivolts to nitric oxide concentration<br />
in picomo1es.............. ................... 100<br />
Figure 4.4: Re<strong>ac</strong>tion equations used to release nitric oxide from other nitrogen compounds 103<br />
Figure 5.1: Schematic diagram of how the analysers were pl<strong>ac</strong>ed .... Llz<br />
Figure 5.2: An example of tr<strong>ac</strong>ing from the testing....... .. 113<br />
Figure 5.3: Photographs of one of the children performing the exhalation........................... I 16<br />
Figure 6.1: Recording of the calibrations for NO, CO2 and pressure ana1ysers.................... 133<br />
Figure 6.2: Recording of the calibration of the flow rotameter and pneumot<strong>ac</strong>hograph....... 135<br />
Figure 6.3: Schematic diagrams of the two different types of connections: direct and t-piece<br />
measurements............. .................. 137<br />
Figure 6.4: Example of the chart recording rolls for the direct versus t-piece measurements.<br />
140<br />
Figure 6.5: Example of recording on one subject -<br />
Page<br />
direct and t-piece measurements .......... 141<br />
Figure 6.6: Mean exhaled NO levels measured by direct and t-piece systems......................I42<br />
Figure 6.7: Example of a recording for the two systems............... .... L42<br />
Figure 6.8: Mean exhaled COz levels measured by direct and t-piece systems..... ................ I44<br />
Figure 6.9: Comparisons of the peak NO with area under the curve... ................ 145<br />
Figure 6.10a: Time to peak NO and peak CO2 measured by the direct system..................... 146<br />
Figure 6.10b: Time to peak NO and peak CO2 measured by the t-piece system...................147<br />
Figure 6.1Ia: COz levels at peak NO and at peak CO2 measured by the direct system ........147<br />
Figure 6.1Ib: CO2 levels at peak NO and at peak CO2 measured by the t-piece system ...... 148<br />
Figure 7.1: Exhaled NO results with increasing expiratory flows .....I57<br />
Figure 7.2:Example of the tr<strong>ac</strong>ing in one subject at two different expiratory flows ............ 158<br />
Figure 7.3: The effect of pressure on the calibration gas measurement ......... ..... 160<br />
Figure 7.4: Exhaled NO results at increasing expiratory mouth pressure ........... 161<br />
Figure 7.5: Measurement of exhaled NO incorporating the reservoir system ..... 165<br />
Figure 7.6: Photographs of the changing ambient NO concentration recordings.................. 166<br />
Figure 7.7: Recording from one subject showing NO results with exhalations from low and<br />
high b<strong>ac</strong>kground NO.... ................ 167<br />
Figure 7.8: The effect of high and low pressure on the calibration gas measurement........... 167<br />
Figure 7 .9: The effect of consuming water on the subsequent exhaled NO levels measured 170<br />
Figure 7.10: Hyperbolic relationship between exhaled NO and sampling flow rate.............172<br />
Figure 7.11: Exhaled NO determined at single breath plateau concentrations at increasing<br />
expiratory flows and at increasing expiratory mouth pressures... ......173<br />
Figure 8.1: Peak exhaled NO results in healthy children.... ............... 183<br />
Figure 8.2a: Comparison of peak exhaled NO in boys and girls measured by the direct system.<br />
184<br />
Figure 8.2b: Comparison of peak exhaled NO in boys and girls measured by the t-piece<br />
system......<br />
................... 184<br />
XVI


