Simulation of Herbicide Persistence in Soil
Simulation of Herbicide Persistence in Soil
Simulation of Herbicide Persistence in Soil
- No tags were found...

Create successful ePaper yourself
Turn your PDF publications into a flip-book with our unique Google optimized e-Paper software.
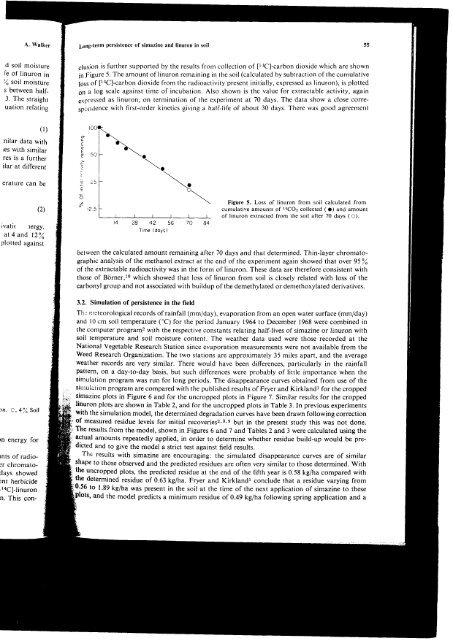
A. WalkerIrng-term persistcnce <strong>of</strong> simaz<strong>in</strong>c and l<strong>in</strong>uron <strong>in</strong> soil55d soil moistureie <strong>of</strong> l<strong>in</strong>uron <strong>in</strong>( soil moistures between half-3. The straightuation relat<strong>in</strong>gclusion is further supported by the results from collection <strong>of</strong> ILlc]-carbon dioxide which are shown<strong>in</strong> Figure 5. The amount <strong>of</strong> l<strong>in</strong>uron rema<strong>in</strong><strong>in</strong>g <strong>in</strong> the soil (calculated by subtraction <strong>of</strong> the cumulativeloss <strong>of</strong> [1aC]-carbon dioxide from the radioactivity present <strong>in</strong>itially, expressed as l<strong>in</strong>uron), is plottedon a log scale aga<strong>in</strong>st time <strong>of</strong> <strong>in</strong>cubation. Also shown is the value for extractable activity, aga<strong>in</strong>expressed as l<strong>in</strong>uron, on term<strong>in</strong>ation <strong>of</strong> the experiment at 70 days. The data show a close correspor.ldencewith first-order k<strong>in</strong>etics giv<strong>in</strong>g a half-life <strong>of</strong> about 30 days. There was good agreement(l)nilar data withres with s<strong>in</strong>rilarres is a furtherilar at differentt coFs50= :_..erature can be(2)ivati< .tergy.at 4 and 12\plotted aga<strong>in</strong>st:n. C, 4i{ <strong>Soil</strong>In energy forrnts <strong>of</strong> radio-3r chromato-Cays showed:nt herbicide.raClJ<strong>in</strong>uronn. This con-6(d 4t fbTime {doys)Figure 5, Loss <strong>of</strong> l<strong>in</strong>uron from soil calculated fromcumulative amounts <strong>of</strong> liCOz collected ( o) and amount<strong>of</strong> l<strong>in</strong>uron extracted from the soil after 70 days (O).between the calculated amount rema<strong>in</strong><strong>in</strong>g after 70 days and that determ<strong>in</strong>ed. Th<strong>in</strong>-layer chromatographicanalysis ol the methanol extract at the end <strong>of</strong> the experiment aga<strong>in</strong> showed that over 957"<strong>of</strong> the extractable radioactivity was <strong>in</strong> the form <strong>of</strong> l<strong>in</strong>uron. These data are therefore consistent withthose <strong>of</strong> Bcirner,lo which showed that loss <strong>of</strong> l<strong>in</strong>uron from soil is closely related with loss <strong>of</strong> theerbonyl group and not associated with buildup <strong>of</strong> the demethylated or demethoxylate derivatives.3.2. <strong>Simulation</strong> <strong>of</strong> persistence <strong>in</strong> the fieldTh,) nleteorological records <strong>of</strong> ra<strong>in</strong>fall (mm/day), evaporation from an open water surface (mm/day)and l0cm soi[ temperature ("C) for the period January 1964to December 1968 were comb<strong>in</strong>ed <strong>in</strong>the computer programz with the respective constants relat<strong>in</strong>g half-lives <strong>of</strong> simaz<strong>in</strong>e or l<strong>in</strong>uron withsoil temperature and soil moisture content. The weather data used were those recorded at theNational Vegetable Research Station s<strong>in</strong>ce evaporation measurements were not available from theWeed Research Organization. The two stations are approximately 35 miles apart, and the averageweather records are very similar. There would have been differences, particularly <strong>in</strong> the ra<strong>in</strong>fallpattern, on a day-to-day basis, but such differences were probably <strong>of</strong> little importance when thesimulation program was run for long periods. The disappearance curves obta<strong>in</strong>ed from use <strong>of</strong> thesitnuiation program are compared with the published results <strong>of</strong> Fryer and Kirklandl flor the croppedsimaz<strong>in</strong>e plots <strong>in</strong> Figtrre 6 and for the uncropped plots <strong>in</strong> Figure 7. Similar results for the croppedl<strong>in</strong>uron plots are shown <strong>in</strong> Table2,and for the uncropped plots <strong>in</strong> Table 3. In previous experimentswith the simulation model, the determ<strong>in</strong>ed degradation curves have been drawn follow<strong>in</strong>g correction<strong>of</strong> measured residue levels for <strong>in</strong>itial recoveries2,3'e but <strong>in</strong> the present study this was not done.The results from the model, shown <strong>in</strong> Figures 6 and 7 and Tables 2 and 3 were calculated us<strong>in</strong>g theactual amounts repeatedly applied, <strong>in</strong> order to determ<strong>in</strong>e whether residue build-up would be predictedand to give the model a strict test aga<strong>in</strong>st field results.The results with simaz<strong>in</strong>e are encourag<strong>in</strong>g: the simulated disappearance curves are <strong>of</strong> similarshape to those observed and the predicted residues are <strong>of</strong>ten very similar to those determ<strong>in</strong>ed. Withthe uncropped plots, the predicted residue at the end <strong>of</strong> the fifth year is 0.58 kg/ha compared withthe determ<strong>in</strong>ed residue <strong>of</strong> 0.63 kg/ha. Fryer and Kirklandl conclude that a residue vary<strong>in</strong>g from0'56 to 1.89 kg/ha was present <strong>in</strong> the soil at the time <strong>of</strong> the next application <strong>of</strong> simaz<strong>in</strong>e to theseand the model predicts a m<strong>in</strong>imum residue <strong>of</strong> 0.49 kg/ha follow<strong>in</strong>g spr<strong>in</strong>g application and a